2016 YTD investment performance thread

As of today my equity portfolio:

-2.8% in trackers (VT & VOE)
+8.2% in individual portfolio

In the beginning of the year performance between my two segments (tracker & individual) suddenly differed quite drastically, after 5-6 years of moving roughly in sync.
 
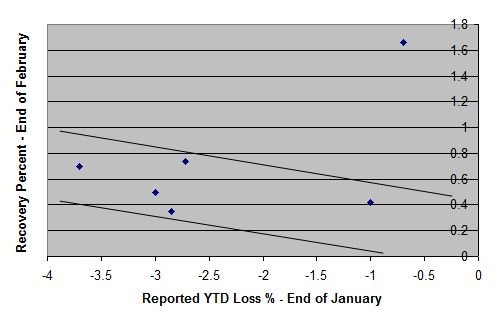
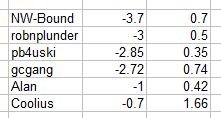
For the few here that reported at the end of January and the end of February, I've plotted the results. So, the month of February saw improvements in the range of .35% to .74% with the larger improvements seen by those that got hit the hardest in January. This is expected and it looks like we have some consistent reporting, for the most part. There is one outlying point not fitting the expectation. It's on the good side, so maybe that strategy should be examined ;)

I could name names, but I figured it's more interesting to get comments (and see if you can spot yourself) first.
Time to have a look at the results! I hope I got this right. It's left to right from the list.

But as we're talking about here..."timing is everything"
 

Attachments

  • FebResultsKey.jpg
    FebResultsKey.jpg
    15.7 KB · Views: 122
  • FebResults.jpg
    FebResults.jpg
    28.8 KB · Views: 14
Time to have a look at the results! I hope I got this right. It's left to right from the list.

But as we're talking about here..."timing is everything"

S&P 500 lost a fraction between 1/31/16 & 2/29/16. During the same span, my investment went up a bit b/c of short term trades, and dividends.
 
Wow, how nice to see that I brought up the rear of that short list as of 2/29. :)

As of today, I am back to even with 12/31/2015 (just missing a couple of $K). Yes, I made 3% this week. Does that change my standing any?

But seeing that most indices are still in the red YTD, and also that I have so little bonds to help my 60% stock which also has quite a bit of that stinkin' international, I do not think I am doing too badly.
 
Last edited:
Performance of
VWENX (Wellington) through 2/29/2016 is -3.01%
Through yesterday: -1.62%
Through today: -1.18%
I found that the -3.01% VWENX number is the Year-to-Date as of 02/29/2016, listed on Vanguard Site. Googlefinance is using that as YTD performance.
 
Time to have a look at the results! I hope I got this right. It's left to right from the list.

But as we're talking about here..."timing is everything"


I have the honor of being the dot in the upper RHS of the chart.
But need to disclose that my portfolio is heavy in Preferred Stock and ETDs. I do not own any Mutual Funds, any Index Funds or ETFs.

I am not a Boglehead. But have great respect for their 3 index fund portfolio - might convert to that as advancing age dulls my senses.

Those who follow the Preferred Stocks thread know that Mulligan & I have similar investing strategies. Thinly traded Utility Preferred Stock make up a disproportionate % of the portfolio. Financial and REIT preferreds, and small amounts of selected blue chips comprise the balance.

Income securities were stable during the Jan-Feb period, and dividends received, plus gains from options trades, gave me the 1.66% YTD gain. There were no deposits or withdrawals for 2016.

I do not expect this ROI to be maintained, but if it does I will be a happy camper.
 
As of close yesterday, down -.98%. Another couple of weeks like the last two, should be moving into the black.
 
Income securities were stable during the Jan-Feb period, and dividends received, plus gains from options trades, gave me the 1.66% YTD gain.

Too bad that ROI isn't expected to continue.

A YTD performance thread like this is pretty much just entertainment; without knowing how much risk the portfolio is taking, the results can't really be compared. As stated earlier, if one compares to a benchmark that matches your allocation, that's probably more informative (but isn't as fun).
 
Wow, how nice to see that I brought up the rear of that short list as of 2/29. :)
Yeah, but if the market is good, you'll probably shoot past the pack.
 
UK based investor here. Good start for me with a YTD +1.7% coming off the back of a +0.9% 2015.

Nothing special in my portfolio - plenty of UK, Aus, US, Europe, Japan equity trackers, UK/Europe commercial property, UK Index Linked Gilts, Cash for a home/to tide me through the bad times and a few percent in gold.
 
As of today my equity portfolio:

-2.8% in trackers (VT & VOE)
+8.2% in individual portfolio

In the beginning of the year performance between my two segments (tracker & individual) suddenly differed quite drastically, after 5-6 years of moving roughly in sync.
BTW, are you still into the magic formula experiment?
 
As of Friday 3/11, looking at Quicken bottom line, I see that I am up $144 compared to 12/31/2015.

Lemme see what that is in terms of percentage...

Oh wait. I have been drawing money to live on. So, my living expenses of 0.5% YTD are really my gain (I draw money as I need, not predraw at beginning of year). It's all right. Let's hope that this trend continues.
 
Last edited:
My YTD return in Quicken as of this morning shows 0.00%. Not too bad considering it was negative 6% a month or so ago.
 
I am UP 1.4% for 2016.

I was DOWN 2.4 % for 2015.

I need 1.0% to return to the opening balance of 2015.....

I have not had to take anything out of my 401k/IRA's since retiring 3 years ago, so it's pretty easy to track how those accounts have done!!!!

YAY!!!!
 
My husband's account is up 2%, he started with 80% cash and 20% stocks. He is too chicken to invest more. I'm ok with it.
Our taxable account went up 15% since the low, but it was down last year. So it's not as exciting as it seems.


Sent from my iPad using Early Retirement Forum
 
Happy St. Patrick's Day! My portfolio finally turned GREEN!

Up a whopping 0.3% YTD.
 
Moved into the black for the first time this year, up 0.59%YTD. Good news, especially given that I retire in two weeks.
 
Down like 3% year to date. Have some plays in oil, biotech and steel that are drawing down portfolio.
 
Up 1.8% YTD as of 3/17.
Just clawed back above the waterline last week.

Just barely broke even (+1.6%) last year.
 
2016 may have turned positive ...but in real terms after inflation, the market is STILL DOWN about 6% from last highs. We've been in reverse since late 2014/ early 2015.
 
+0.7% YTD. Keeping up with inflation which was 1% in February. I'll take it.
 
Last edited:
Back
Top Bottom