OP
OP
barbarus
Recycles dryer sheets
- Joined
- Aug 1, 2007
- Messages
- 433
Dude, if you're dreaming about goats we need to have a little chat...")
Depends if they're nannies or rams.

Dude, if you're dreaming about goats we need to have a little chat...
Dude, if you're dreaming about goats we need to have a little chat...
DW and I went to an excellent play last night called The Goat or who is Sylvia
I didn't know goats could be so sexy until I'd seen the play
It would appear some people agree with you:Oh my friend goats can be VERY sexy..

it's possible that families were spending a higher percent of their incomes on mortgage payments in 2007 than in 1997. If so, they had to spend a lower percent on something else.
Well now, whose fault is THAT?!?
MOVE!
nope, they just borrowed more.. as igsoy also points out.
Household debt is 138% of income (end of '06).
Americans aren't the only people who've been running up debt - The Curious Capitalist - Justin Fox - Economy - Markets - Business - TIME
People who look only at income (and are trying to interpolate CPI from "disposable income" as though that were a closed system) are missing the huge debt factor.
shadowstatistics is grossly wrong. He claims that a worker whose wage increases exactly matched the CPI for the 10 years ending in 2007 actually lost half his purchasing power. On average, wages have gone up a little faster than the CPI, so maybe average purchasing power would have dropped by 40%. But that would mean we're buying 40% fewer kwh of electricty, 40% fewer cars, 40% fewer pairs of shoes, 40% fewer cans of Coke, etc. That didn't happen.
Outstanding household debt: $5.5 and $13.8 Trillion
Disposable Personal Income.: $6.1 and $10.3 trillion
...
When people will jump through hoops to get an extra .25% off their expenses or on their money markets, maybe its a good idea to find out whether your budget is inflating at 2%, 4% or 6%.
Independent, you said:
[Just for the sake of this argument let's leave "hedonics" out of it.. since I don't think std.s of living and actual material consumption have changed radically since 1997 for the vast majority of Americans.]
You found:
$13.8 trillion / $10.3 trillion is 135%, close to Time's 138% figure.
$5.5 t / $6.1 t = 90%
The difference between 90% and 135% is 45%. Take out the little bit over CPI for wages (shadowstats assumed exact match) and that 45% may get close to 50%.
In 1997 they used to spend less than their income in the aggregate, in 2007 they spend more. 100 =>145 over 10 years = +3.79%/year added to what people've been spending of their disposable income for whatever reason.
If, in the aggregate, people have been spending that much over the reported CPI for roughly the same stuff.. then that's your "shadow inflation." At least that's how I see it for now.
What I want to know is:
Why is the government lying to us about inflation?
Especially when smart people know they are doing it
So they can screw everyone out of CPI adjusted paychecks!
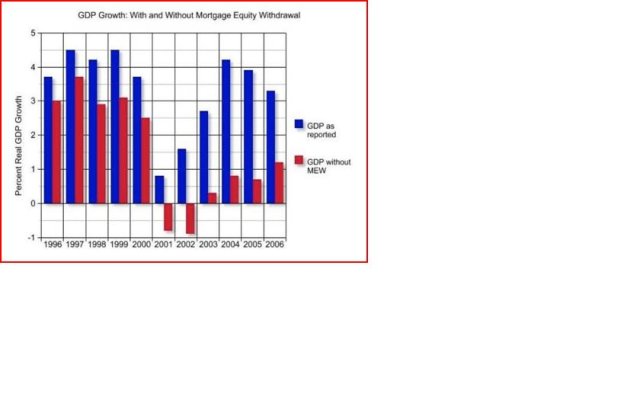
This is the chart I referred to earlier
I don't know how to modify the chart but...
I mentioned cars because someone else did.. (?)
Number of car sales isn't the point; population goes up so car sales mostly will, too.
Jan. 1997 US pop. est. = 266,490,000
now about 300 million
Actually, I'm surprised that 33 million more people "only" translated into 6 million more cars on the road.. since a 2005 figure put US cars at 776/1000 people.
UNECE Trends 2005 - Transport
Then there are peaks in sales due to easy credit and other promotions: 2000 is at the cusp of another bubble.. just like number of home sales peaked last year.
I'm not 'invested' in proving the shadowstats guy right or wrong.. I don't really follow him. I just generally agree that the dollar's purchasing value has declined more than most people/media/politicians choose to notice. To me, 40% (or whatever) divergence has largely been bridged in recent years via debt. That level of debt being unsustainable will create instability.. whether the debt is made to seem to go away artificially for some players at some level or not.
But the discussions seem to be on issues that involve fractions of percents, not multiple percents.
I give all that work more credibility than the average American who says that gas and milk are up a lot more in the past year than the CPI, and therefore the CPI must be garbage.
(Or, in the case of shadowstatistics, someone who says that we should trust his black box because it spits out numbers we want to believe.)
If I could get specific info from him for your review and you found his calculations to be correct, then what? Would admit inflation is much higher than the 3 or 4% the BLS is telling us? Besides most of the country (91% in one poll) do not believe it is being calculated correctly. Why are you so sure we should trust the government on this? There are numerous instances of less than truthful government reporting over the history of this country. Politicians do fabricate, that's a given. Politicians have many reasons to be fudging the CPI.