Article on safe withdrawal rates

Most of you math weenies are out of my league, but isn't comparing economies of the 1920's almost like comparing it to 1000 years ago? As things have evolved, even the 1950's are from the dark ages when trying to form comparisons.

It's an entirely different world/economy/measurements/planet isn't it?
Yes. I think that some people (me included), however, follow the adage that history repeats itself. It's not the exactness of history that will repeat, but to say that we won't have cycles and major events in the future as we have in the past is being naive IMO. I think that's what people are saying...history is not the perfect indicator of future performance...but if you can come up with a better one...let us all know. :)
 
Most of you math weenies are out of my league, but isn't comparing economies of the 1920's almost like comparing it to 1000 years ago? As things have evolved, even the 1950's are from the dark ages when trying to form comparisons.

It's an entirely different world/economy/measurements/planet isn't it?
What would you suggest for comparison?
 
Most of you math weenies are out of my league, but isn't comparing economies of the 1920's almost like comparing it to 1000 years ago? As things have evolved, even the 1950's are from the dark ages when trying to form comparisons.

It's an entirely different world/economy/measurements/planet isn't it?


no not all. these studies use the worst returns ever to form their basis.. bad returns are timeless ,if it was a horrible return and it was 100 years ago then thats the target we figure.

there is alot of misconception that these studies need some kind of historical average to work so basing it on results 100 years ago is silly .

they do not use average returns. they only work with the worst returns of the bunch.
 
Last edited:
Yes. I think that some people (me included), however, follow the adage that history repeats itself. It's not the exactness of history that will repeat, but to say that we won't have cycles and major events in the future as we have in the past is being naive IMO. I think that's what people are saying...history is not the perfect indicator of future performance...but if you can come up with a better one...let us all know. :)

im of the belief that history never repeats itself . the only thing that repeats itself is historians.

i always find that even given the same set of events the results come out just different enough to alter the results.

first iraq war we tanked on the onset. 2nd iraq war we soared on the onset.
 
they do not use average returns. they only work with the worst of the bunch.

I don't know which studies you're refering to when you say "they," but FireCalc uses all return data and inflation data from the relavent historical period, not just the worst.
 
correct me if im wrong but isnt the swr based on what it would take to have those 30 year periods that had the worst returns statistacally pass for that group of retirees ?

all rolling periods of 30 year time frames are analyzed and then the swr is calculated to accomodate the worst of the bunch.

the historical average swr for a 60/40 mix is 6.82% but in order to get the worst of the periods to pass muster 4% is used.
 
Last edited:
correct me if im wrong but isnt the swr based on those 30 year periods that had the worst returns and how the retirees would have done statistically with different allocations over those time frames?.

A WR over a time period, say 30 yrs, is tested vs. investment returns and inflation rates and the percentage of starting years which succeed is stated as a success rate and the percentage of starting years which fail (run out of money) is stated as a failure rate. A SWR is a withdrawal rate which causes some target X percentage of starting years to be successful. For example, in one function of FireCalc, I could determine what dollar amount I could withdraw anually from a given portfolio and have 95% of the trials be successful when backtested against historical data.

The strength of FireCalc is in the total data output (available as Excel downloads) for a given scenario and this involves all the data, not just the "worst" investment return vs inflation year.
 
Last edited:
correct me if im wrong but isnt the swr based on what it would take to have those 30 year periods that had the worst returns statistacally pass for that group of retirees ?

all rolling periods of 30 year time frames are analyzed and then the swr is calculated to accomodate the worst of the bunch.

the historical average swr for a 60/40 mix is 6.82% but in order to get the worst of the periods to pass muster 4% is used.
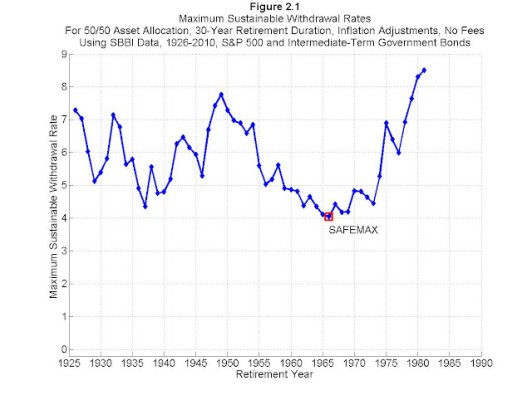
Perhaps a picture would be worth a thousand words here. As mathjak and others state, historically a retiree could have withdrawn more than 4% over most any 30 year period in the various studies, often much more. Problem is, none of us can know who will draw the short straw in terms of when we retire, and who the lucky ones will be - hence 4% is considered (95%) safe in the face of the unknowns.

The chart below shows exactly how much you could have withdrawn over 30 years (plus inflation) had you retired beginning in each year shown on the x-axis (isn't hindsight wonderful). In 1929 you could have withdrawn 5%, would you have guessed that? After WWII you could have withdrawn 7%. And you could have safely withdrawn 8% if you retired in 1980 (like my parents).

Of course we could indeed have a worse sequence and/or period of 30 year returns than the mid-60's, especially if the SWR studies of other countries are considered.

There are simply too many variables, so there is no right answer. You make an educated guess based on the information available (including market data like FIRECALC use if you wish), your risk tolerance, plan longevity, spending and many other factors - and then have a plan B (or several options) as well. The best any of us can do without a generous trust/inheritance...and go on living.
 

Attachments

  • SWR-by-year.jpg
    SWR-by-year.jpg
    74.3 KB · Views: 29
Last edited:
im of the belief that history never repeats itself . the only thing that repeats itself is historians.

i always find that even given the same set of events the results come out just different enough to alter the results.

Yes. As Mark Twain said, "History doesn't repeat itself, but it does rhyme".

The problem is that we will know what stays similar and what changes only after the fact. Looking ahead, many people say the US history will rhyme with the past histories of Rome, the Spanish and British Empires. Some say it won't. Who really knows?
 
i like that, i never heard that lil saying before... lol
 
Perhaps a picture would be worth a thousand words here. As mathjak and others state, historically a retiree could have withdrawn more than 4% over most any 30 year period in the various studies, often much more. Problem is, none of us can know who will draw the short straw in terms of when we retire, and who the lucky ones will be - hence 4% is considered (95%) safe in the face of the unknowns.

The chart below shows exactly how much you could have withdrawn over 30 years (plus inflation) had you retired beginning in each year shown on the x-axis (isn't hindsight wonderful). In 1929 you could have withdrawn 5%, would you have guessed that? After WWII you could have withdrawn 7%. And you could have safely withdrawn 8% if you retired in 1980 (like my parents).

Of course we could indeed have a worse sequence and/or period of 30 year returns than the mid-60's, especially if the SWR studies of other countries are considered.

There are simply too many variables, so there is no right answer. You make an educated guess based on the information available (including market data like FIRECALC use if you wish), your risk tolerance, plan longevity, spending and many other factors - and then have a plan B (or several options) as well. The best any of us can do without a generous trust/inheritance...and go on living.

It is interesting that the Safemax WD point occurred in 1965, right before the strongest bout of prolonged inflation the US has experienced (as far as I know, please correct me if wrong). This would seem to indicate that inflation is a far greater danger for Safemax WD than depression/deflation ala 1930's.
 
Mark Twain made many witty comments which have been quoted often. But one must be careful not to take some of his words too literally. For example, he said

"Put all your eggs in one basket, and watch that basket" - Mark Twain​

Not a good move, right? Right!

Mark Twain made a very bad investment and had to file bankruptcy. Surely, one can watch his only basket, but what can one do but watch when a Godzilla comes along and tramples it?

PS. Some said this quip originated with Andrew Carnegie, and no clear resolution has been found. The same saying was found in books authored by both, but the publication date of Carnegie's book was not clear.

PPS. Mark Twain might be a lousy investor, but a scrupulous man. He repaid all his debts after having to file for bankruptcy, even though he was cleared from obligations to do so. An honorable man!
 
Last edited:
It is interesting that the Safemax WD point occurred in 1965, right before the strongest bout of prolonged inflation the US has experienced (as far as I know, please correct me if wrong). This would seem to indicate that inflation is a far greater danger for Safemax WD than depression/deflation ala 1930's.
It sounds like a reasonable cause of failure. A bit scary to someone like me eying retirement next year. All those QE's the Fed Has been giving us may be saving us from deflation, or it may be priming the inflation pump. I hope they throttle it just right. I worry a little that there is a lot of money just sitting there, but will come pouring in when things start to get better.

But so far the discussions have eased my mind a bit about a 4 to 5 percent withdraw rate
 
since i live in nyc i guess hurricane sandy is the reminder that all the back testing and preparing for the worst eventually is a moot point as something from left field as rare as it is crops up and gets us.

now sandy will be the new contruction standard and it will work until the new normal in our weather beats sandy out.
 
i thought bill bernsteins switch in sentiment about retirees not owning equities was kind of strange too.

in his e-book the ages of the investor bill shuns all equities for tips,annuities and short term bonds . if you have any extera dough after meeting your income needs you can through it in a risk portfolio.

but then are we not back on the path to a balanced portfolio anyeway?

sounds great living without equities but it isnt until page 35 where you find out
that you will have to expect a lower level of income from this method if it is going to be considered safe..

because without equities there isnt enough ooomph to generate the higher levels of income that other portfolios do,.


bills own view of his method and his own words:

"below 65 2% is bullet proof."

"3% is probaly safe

4% is taking chances

above 5% you stand a serious risk of dying poor."


----------------------------------------------------------------------------


the success of this portfolio above 2% has no better chances than the tried and true other methods that run at a 4% withdrawal and use equities. in fact the odds favor the traditional 4% swr having a 97% success rate which is far better than bills with all his talk of risk taking.

the biggest risk is you need more than 2% to live on.

i would only give the thumbs up to bills if you can live with only a 2% rate otherwise all bets are off unless as he calls it the RP or risk portfolio is used to sustain his LMP ( liability matched portfolio.)

i do fall in the catagory of needing 2% myself but to be honest i dont have enough faith in bills risk free portfolio to even pull that off . if i did do something like that i would without question add a risk portfolio as he calls it as insurance that it wont fail.
 
Last edited:
Dwhit said:
It sounds like a reasonable cause of failure. A bit scary to someone like me eying retirement next year.

1966-1982 was also a 16 year secular bear market characterized by huge swings in the major indices. Yes, there was higher than average inflation, especially in the later years of that period, but the stock market over that period did not see much if any increase.

So inflation is an enemy, but it's even worse when combined with no increase in stocks.
 
i thought bill bernsteins switch in sentiment about retirees not owning equities was kind of strange too.

in his e-book the ages of the investor bill shuns all equities for tips,annuities and short term bonds . if you have any extera dough after meeting your income needs you can through it in a risk portfolio.
We've had this discussion here before, and what Dr Bernstein said.
WB: "His latest obsession, resulting in the short e-book "The Ages of the Investor," ...
This seems to be what alarmed a lot of retirees:
WB: "How risky stocks are to a given investor depends upon which part of the life cycle he or she is in. For a younger investor, stocks aren't as risky as they seem. For the middle-aged, they're pretty risky. And for a retired person, they can be nuclear-level toxic."
Of course stocks can be nuclear level toxic for retirees, otherwise you'd have FAs advocating high equity asset allocations. When has that ever been true? Never in my lifetime...

Instead of advocating some seemingly arbitrary asset allocation, the fashion now seems to be have enough safe assets to ensure your basic needs are met, and then take some risk with the excess if you like. And the latter does make more sense than some arbitrary AA such as '100-age' in equities. If you have no excess you can't afford any risk, if you have double the nest egg needed when you retire, you could put as much as half your portfolio in equities. Using '100-age' in both these cases makes no sense whatsoever.

WB goes on to say:
WB: "You want to end up with a portfolio that matches your liabilities, meaning the amount you'll need to spend in retirement. The rule of thumb I came up with, based on annuity payouts and spending patterns late in life, is that you should save 20 to 25 times your residual living expenses -- that is, the yearly shortfall you have to make up after Social Security and any pension.

This portfolio should be in safe assets: Treasury Inflation-Protected Securities, annuities, or even short-term bonds.
Anything above that, you can invest in risky assets. That's your risk portfolio. If you dream about taking an around-the-world trip, and the risk portfolio does well, you can use it for that. If the risk portfolio doesn't do well, at least you're not pushing a shopping cart under an overpass."
Dr Bernstein seems to be gravitating toward the floor income concept, not a new idea by any means, the same concept that Wade Pfau, Jim Otar and others have been advocating for some time.

"Shun[ning] all equities for tips,annuities and short term bonds" would only be the case if your portfolio was already in Otar's red zone, IOW if you only have enough to meet your essential expenses, you can't afford to take any (equity) risk. Again, not a new concept...

The worst retirement investing mistake - Sep. 4, 2012
 
Last edited:
marko said:
It's an entirely different world/economy/measurements/planet isn't it?
That's been my contention for some time. ...worst returns [-]ever[/-] so far... :rolleyes:
Whether it turns out to be worse than the Great Depression or the mid-60's is anyone's guess, a case can be made for any POV. I suspect most folks in the 1930's thought it was "an entirely different world/economy/measurement/planet" too.

Again, if history is of little or no value, what would you and marko propose as an alternative for planning purposes?
 
1966-1982 was also a 16 year secular bear market characterized by huge swings in the major indices. Yes, there was higher than average inflation, especially in the later years of that period, but the stock market over that period did not see much if any increase.

So inflation is an enemy, but it's even worse when combined with no increase in stocks.
That time frame was before my time as an investor, but I wonder if an international investor would do better.

So, I looked up the Nikkei. It opened at 1418 in Jan 1966, and closed at 8017 in Dec 1982. That's a return of 5.65X in 17 years, or a 10.7% annual nominal rise. That's not too shabby. It appears that while the US was mired in the Cold War and Vietnam War, the Japanese economy was ramping up very well.

Diversify, diversify, that's all I know to do...

PS. The Nikkei performance above did not include dividends. That would make it a LOT better!
 
Last edited:
What would you suggest for comparison?
My question was theoretical rather than applicative.

I don't know what to compare today to, but to me, the economies and economic drivers today are entirely different than even 40 years ago.

I'm not sure that having nothing better for comparison justifies relying on questionable (in the sense of the sentence above) data.

Granted, if it's "all we have" it makes for an interesting excersize but I"m not sure what conclusions can be safely drawn.

As noted I'm no mathemetician/statistician and I wasn't challenging any position...just asking a question... so if in this case "history is prologue" (somewhat) I'll defer to the experts.
 
One of the things shaping my retirement planning is what happened to my grandparents.

My grandfather retired with full pension at age 55. (Gram was a homemaker). It was a nice pension - more than enough for them to live comfortably. They moved from the Detroit suburbs and rented a nice apartment about 6 blocks from the beach here in San Diego. Life was good.

The pension was not cola'd. But they had SS as well from when he turned 62.

Then the 70's happened with all it's inflation. Since Gramps was already on SS, it made more financial sense for Grammy to head out to work.

So, in her 60's, she got a job as a "shop girl" at a gift shop in La Jolla. I'm not sure she had worked outside the home prior to that, ever.

I look at their plans - and how inflation destroyed the plans... and get nervous. It's enough to keep me in the "one more year" phase longer than I currently plan.
 
Back
Top Bottom