mathjak107
Give me a museum and I'll fill it. (Picasso) Give me a forum ...
- Joined
- Jul 27, 2005
- Messages
- 6,208
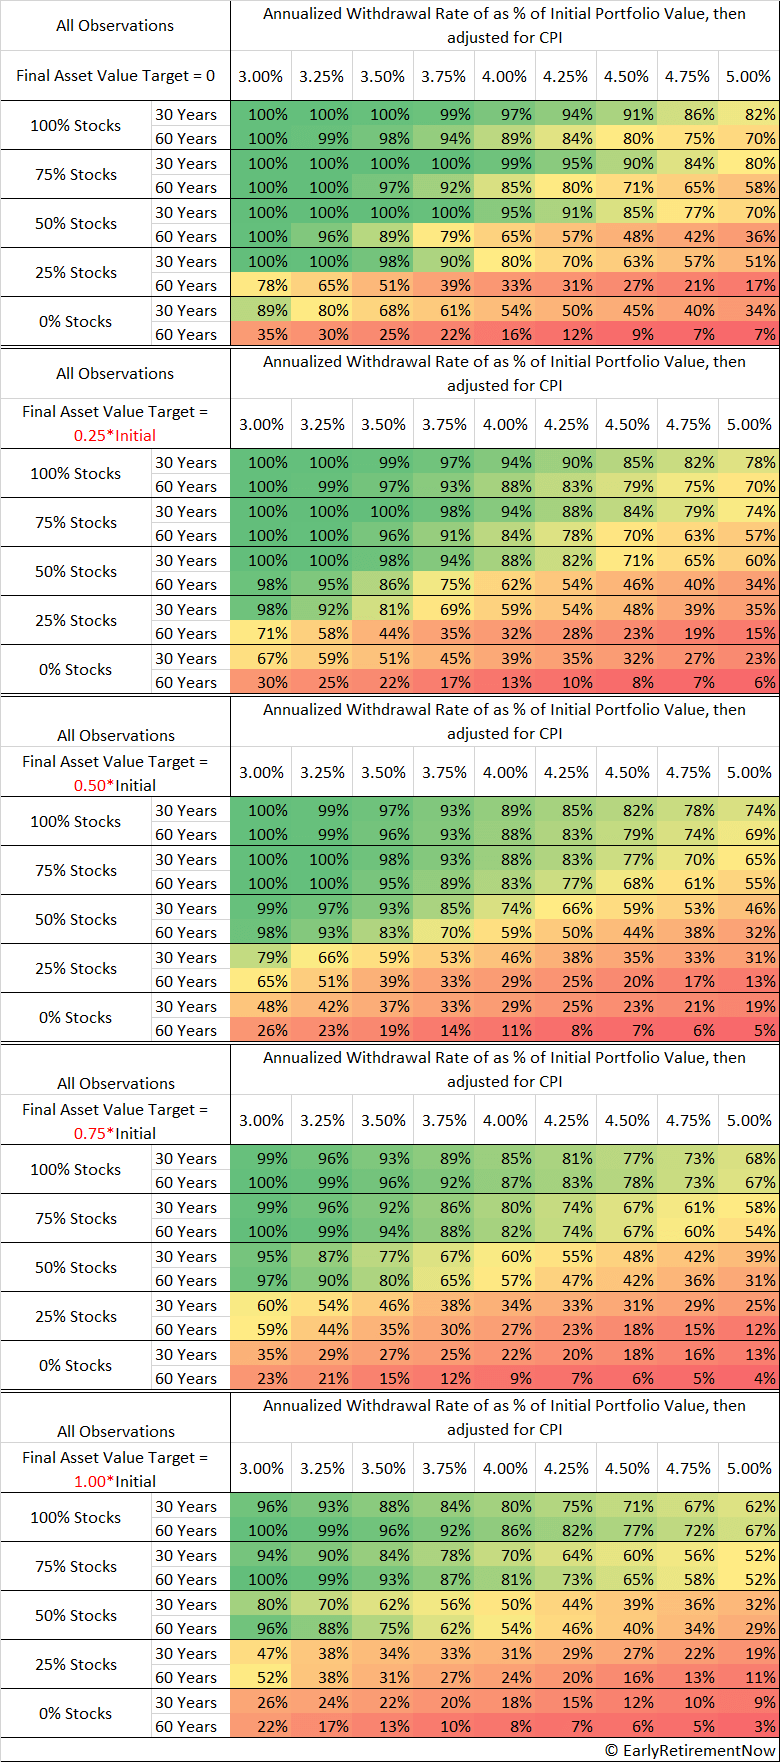
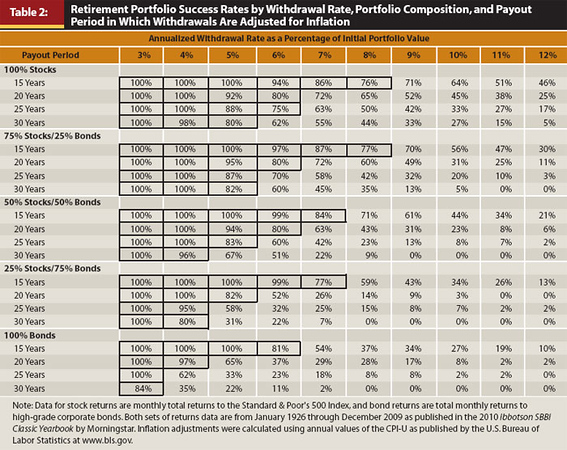
tyler creator of the website portfolio charts did an article on safe withdrawal rates . tyler is also creator of the golden butterfly portfolio.
one of the problems i see in the article is the term safe withdrawal rate is based on retiring in the worst of times which were 1907, 1939, 1937 , 1965 and 1966
all the references in the article start at 1970 which actually misses the worst of times which was 1965/1966 .
really the article in my opinion is about a withdrawal rate but not necessarily what we consider a safe withdrawal rate
https://portfoliocharts.com/2024/03/15/how-to-harness-the-flowing-nature-of-withdrawal-rate-math/
https://www.kitces.com/blog/what-returns-are-safe-withdrawal-rates-really-based-upon/
Last edited: