Best choice: Bond Fund or CD or...

Azanon said:
cd's are generally poor investments, period. For just about every investment climate, you can find a better investment depending on your investment goals.

Your grandpaw who had a high school education at best invested in these for a reason; cause he didn't know any better. (generalizing here... this is not specifically targeted at the OP)

Bond funds are a great choice for part of a diversified portfolio.

CDs are great when you absolutely, positively need/want to have $XXX on a specific date in the future.

With a bond fund, you don't know what the NAV will be on any specific date in the future.
 
2B said:
With a bond fund, you don't know what the NAV will be on any specific date in the future.

Agree, and that's why I call it "forever money".

JG
 
cd's and money markets are a bet rates will stay the same or rise

longer term bonds are a bet rates will stay the same or fall

choose wisely
 
Mr._johngalt said:
Agree, and that's why I call it "forever money".

JG

Absolutely, I agree with you but I see people buying bond funds in their kid's college fund when they'll need the money in 4 years.
 
JohnEyles said:
The way the T'Bills are headed up, the CD return seems barely higher.

Looks like they're not charging a commission at all, as best I can tell.

I wouldn't look for T bills to keep going up. If the Fed raises rates again, they won't be going too far (.25 or.5% tops) before they stop again and then start cutting rates. Personally, I think the next Fed move will be to chop rates.

Schwab doesn't charge a dirrect commission to you. They get paid by the banks.
 
mathjak107 said:
cd's and money markets are a bet rates will stay the same or rise

longer term bonds are a bet rates will stay the same or fall

choose wisely

So why do asset allocation strategies like Bernstein's Four Pillars and ESRBob's Rational Investing use bond funds for a very significant portion of the portfolios? Are they expecting rates to fall?
 
Patrick said:
So why do asset allocation strategies like Bernstein's Four Pillars and ESRBob's Rational Investing use bond funds for a very significant portion of the portfolios? Are they expecting rates to fall?

Because unless you are holding nothing but bonds/bond funds, what they do in isolation is meaningless. What we should be talking about is what these instruments add to a portfolio, not what they do isolation.
 
brewer12345 said:
Because unless you are holding nothing but bonds/bond funds, what they do in isolation is meaningless. What we should be talking about is what these instruments add to a portfolio, not what they do isolation.

OK. Who wants to begin?
 
Patrick said:
OK. Who wants to begin?

Perhaps Saluki can run a return and volatility analysis for a portfolio of 1/3 each Lehman Agg, EAFE, and S&P 500, and show us the stats for each asset class by itself?
 
brewer12345 said:
Perhaps Saluki can run a return and volatility analysis for a portfolio of 1/3 each Lehman Agg, EAFE, and S&P 500, and show us the stats for each asset class by itself?

I hope he can...........I don't have the software to do it, or I would..........

Brewer, you're an analyst.........surely you can do it??
 
FinanceDude said:
Brewer, you're an analyst.........surely you can do it??

Don't have the software. I look at individual securities, not asset classes.
 
brewer12345 said:
Perhaps Saluki can run a return and volatility analysis for a portfolio of 1/3 each Lehman Agg, EAFE, and S&P 500, and show us the stats for each asset class by itself?

Not Saluki, but:

From 1981-2005 [25 years]

Return Stand Dev

LBA 9.55% 0.07582
S&P 500 12.40% 0.15960
EAFE 10.66% 0.22625

1/3 mix 11.41% 0.12924

caveat emptor: these are generated from returns I've snatched off the internet [MSCI website, Vanguard.com, barra.com, etc], so someone might want to check to see if I'm right [or wrong].

- Alec
 
ats5g said:
Not Saluki, but:

From 1981-2005 [25 years]

Return Stand Dev

LBA 9.55% 0.07582
S&P 500 12.40% 0.15960
EAFE 10.66% 0.22625

1/3 mix 11.41% 0.12924

caveat emptor: these are generated from returns I've snatched off the internet [MSCI website, Vanguard.com, barra.com, etc], so someone might want to check to see if I'm right [or wrong].

- Alec

How do you figure Alpha, again?
 
Patrick said:
How do you figure Alpha, again?

Hi Patrick,

I'm a little confused about what you're asking. Alpha is generally used to define the "extra" return over some benchmark that a fund generates. Alpha can also be the positive or negative return of a fund that cannot be explained by an asset pricing model, like the Capital Asset Pricing Model (CAPM) or Fama&French's 3 factor model. Since the LBA, S&P 500, and MSCI EAFE are indexes there is no alpha.

- Alec
 
ats5g said:
Hi Patrick,

I'm a little confused about what you're asking. Alpha is generally used to define the "extra" return over some benchmark that a fund generates. Alpha can also be the positive or negative return of a fund that cannot be explained by an asset pricing model, like the Capital Asset Pricing Model (CAPM) or Fama&French's 3 factor model. Since the LBA, S&P 500, and MSCI EAFE are indexes there is no alpha.

- Alec

I think what Patrick really wants to look at is the Sharpe ratio.
 
ats5g said:
Hi Patrick,

I'm a little confused about what you're asking. Alpha is generally used to define the "extra" return over some benchmark that a fund generates. Alpha can also be the positive or negative return of a fund that cannot be explained by an asset pricing model, like the Capital Asset Pricing Model (CAPM) or Fama&French's 3 factor model. Since the LBA, S&P 500, and MSCI EAFE are indexes there is no alpha.

- Alec

Well, Brewer said that we should be talking about what each asset class adds to a portfolio. Since the blend of the 3 indexes produces a pretty good return with reduced standard deviation, can't we calculate an Alpha for that blend versus, say, the S&P 500 to determine how much "better" that blend would be than just holding an S&P 500 index fund?
 
Patrick said:
Well, Brewer said that we should be talking about what each asset class adds to a portfolio. Since the blend of the 3 indexes produces a pretty good return with reduced standard deviation, can't we calculate an Alpha for that blend versus, say, the S&P 500 to determine how much "better" that blend would be than just holding an S&P 500 index fund?

Sure i'll post the sharpe ratios tomorrow. fyi - the sharpe ratio is the excess return [over the Tbill] divided by the standard deviation.

- Alec
 
Sharpe Ratios:

LBA 0.53278
S&P 500 0.48784
EAFE 0.31075

1/3 in each 0.51978

Sharpe ratios for the portfolio kept increasing until it reached 0.64203 when the portfolio mix mix was:

LBA 71.33%
S&P 500 21.36%
EAFE 7.30%

However, I've only got annual data for the three indices and Tbills, and not monthly data, which is really what one wants to use to calculate Sharpe Ratio.

In case anyone is kinda confused about why Sharpe Ratios are useful, check out The Sharpe Ratio from Moneychimp.

So, next time someone tells you that you should be 100% in any investment, referring to your well diversified portfolio, you can say, "No thanks, my portfolio's Sharp Ratio is higher than that portfolio." ;)

- Alec
 
ats5g said:
So, next time someone tells you that you should be 100% in any investment, referring to your well diversified portfolio, you can say, "No thanks, my portfolio's Sharp Ratio is higher than that portfolio." ;)

- Alec

Alec, what time period did you use in calculating the ratios?

Bear in mind that the Sharpe ratio is helpful, but shouldn't be used in isolation. After all, we all know that a 70+% FI portfolio over the long term is certain death for retirees.
 
brewer12345 said:
Alec, what time period did you use in calculating the ratios?

Bear in mind that the Sharpe ratio is helpful, but shouldn't be used in isolation. After all, we all know that a 70+% FI portfolio over the long term is certain death for retirees.

From 1981-2005 [25 years]

People should remember that in MPT the Sharpe Ratio is really only useful to find out what portfolio one should use to mix with the risk free asset [like Tbills].

However, note that MPT is only concerned with returns one time period out [like a year], while we're concerned with investing for consumption over a lifetime, so Tbills may not really be all that risk free like TIPS may.

Getting back to the original poster's question of Bond funds or CD's, the answer may be a bit of both. If one were to substitute CD's as the risk free asset, one could combine CD's with a "risky portfolio" of bond funds, stock funds, etc. Heck, the fed govt's TSP already did this in its L funds, see page 2, using its stable value fund [the G fund] as the risk free asset. Note that all the L funds use all 5 stock and bond funds.

- Alec
 
ats5g said:
Sharpe Ratios:

LBA 0.53278
S&P 500 0.48784
EAFE 0.31075

1/3 in each 0.51978

Sharpe ratios for the portfolio kept increasing until it reached 0.64203 when the portfolio mix mix was:

LBA 71.33%
S&P 500 21.36%
EAFE 7.30%

However, I've only got annual data for the three indices and Tbills, and not monthly data, which is really what one wants to use to calculate Sharpe Ratio.

In case anyone is kinda confused about why Sharpe Ratios are useful, check out The Sharpe Ratio from Moneychimp.

So, next time someone tells you that you should be 100% in any investment, referring to your well diversified portfolio, you can say, "No thanks, my portfolio's Sharp Ratio is higher than that portfolio." ;)

- Alec

Thanks for that, Alec. So we want the portfolio with the highest ratio? ESRBob, in his book "Work Less, Live More" shows what he calls Alpha, which is a percentage that a particular portfolio is better than the index, i.e., one portfolio has an Alpha of 6%, meaning that it did 6% better than the S&P 500 on a risk-adjusted basis. Is this the same Alpha that stock analysts use?
 
Patrick said:
Thanks for that, Alec. So we want the portfolio with the highest ratio? ESRBob, in his book "Work Less, Live More" shows what he calls Alpha, which is a percentage that a particular portfolio is better than the index, i.e., one portfolio has an Alpha of 6%, meaning that it did 6% better than the S&P 500 on a risk-adjusted basis. Is this the same Alpha that stock analysts use?

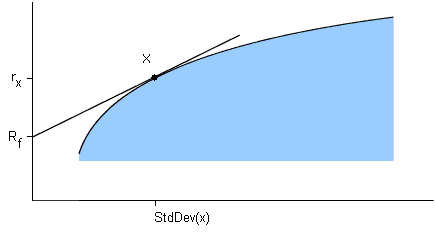
Yes, if all you're concerned about is returns vs. standard deviation, then the higher the sharpe ratio the "more utility" [i.e. higher level of happiness/satisfaction] you'll get. If you look at the attached picture below, the sharpe ratio is simply the slope [i.e. rise/run] of the line that goes from the risk free rate [Rf] to a portfolio located on the efficient frontier [X]. The portfolio that is touched when the line become tangent to the efficient frontier [or "tangency portfolio" or "X"] gives the highest slope of the line, and thus the highest sharpe ratio.

The next step is to mix some of the risk free asset [Rf] with the mix of risky portfolio ["X"], which may contain stocks and bonds, to satisfy your risk tolerance. So, for example, really risk averse investors could choose to invest 80% in Rf and only 20% in X. That's the theory anyway.

Note, however that this portfolio may not give you enough return to enable you to meet your savings/spending goal [as Brewer pointed out].

No, I think that Bob was not using the typicaly definition of alpha that stock analysts use. I think Bob was more or less saying by being more diversified than the S&P 500 [with a small value tilt, adding int'l, etc.], you got a higher return for the same risk.

Alpha is usually defined as the extra return that a manager adds that cannot be explained by the fund's exposure to various risk factors. In the case of the Capital Asset Pricing Model [CAPM], there is only market risk, but in Fama&French's 3 factor model there are also risks associated with value stocks and small stocks.

Normally, when one calculates alpha, one does a statistical regression to see if there is any extra return that cannot be explained by some explanatory variable. In the case of CAPM, it is the return of the market [i.e. TSM or S&P 500] minus the return of some risk free asset [Tbills]. In F&F 3 factor model, there are two other explanatory variables that when added can better explain the returns of diversified stock portfolios: the so called "value factor" (HML - High minus low) and "small factor" (SMB - small minus big).

Anyway, back to beating the S&P 500 on a risk adjusted basis. There are a number of ways to calculate risk adjusted returns. One way I've seen is to use:

[(ave return of portfolio) – (ave return of Tbill)]*[(SD of index)/(SD of portfolio)] + ave return of Tbill

For example, the risk adjusted return of a portfolio invested in 1/3 LBA, S&P 500, and EAFE vs. the S&P 500 alone is around 14%, which is higher than the average return of the S&P 500. Both this and the sharpe ratio are just another way of saying, "You get more return per unit of risk compared to "X"."

Of course, one should always ask why the sharpe ratio is higher or the risk adjusted return is higher. The reason is that with slice and dice portfolios like in Bob's book, or Coffeehouse, etc., you're usually adding asset classes that are not highly correlated with each other. Also, the slice and dice portfolios include more small cap stocks and more value stocks than are in the S&P 500, and since small and value have had higher returns than the S&P 500, the slice and dice portfolios have performed better. However, most of the slice and dice portfolios have the same standard deviation or less than the S&P 500 with a higher return. Hence free lunch, unless of course one believes Fama&French that small and value are actually riskier. But, I wouldn't call this alpha since the extra return is due mostly to tilting towards small and value.

- Alec

modified at 1:46 on 11/2/06
 

Attachments

  • sharpe_ratio.gif
    sharpe_ratio.gif
    2.3 KB · Views: 4
  • sharpe_ratio.gif_thumb
    5.4 KB · Views: 0
OK, first off thanks for all the help/guidance/suggestions/information. So, I decided to put the cash in a 6 month CD that pays 5.114 APY. (It's in a tax-deferred account). The money comes from my one remaining stock position which I closed out (Apache Oil: APA) which was a long-term investment). I am already loaded up on REIT funds; TIPS funds and Income producing funds so it seemed that maybe a CD fund might be a good option as per income producing diversification. Maybe in six months we can do this all over again.
 
Back
Top Bottom