Good Housing Interview With Robert Shiller from Nov 2009

Fits my expectations for my weekend house (which also serves as a potential safety net). I hope to take my primary residence with me so it's absolute value is not critical - there I am more concerned about whether the environment stays good so I will be comfortable toddling around on my walker.
 
The most recent case-shiller date, out this past tuesday, shows housing prices declining again. The seemed to peak around this interview, spent a couple of months with no clear trend, but now are on a clear trend down. Slow, but down. They were reported as improving in the financial media because shiller publishes two sets of data - raw data and smoothed - and the smoothed data showed a positive bias.
 
The most recent case-shiller date, out this past tuesday, shows housing prices declining again. The seemed to peak around this interview, spent a couple of months with no clear trend, but now are on a clear trend down. Slow, but down. They were reported as improving in the financial media because shiller publishes two sets of data - raw data and smoothed - and the smoothed data showed a positive bias.

Interesting. Could you tell me where to get this information? What I have encountered seems to have a positive spin put on it, so I haven't been aware of this renewd downward movement.

Ha
 
The data is here S&P | Case-Shiller | United States Comes in excel format.
Registration required, no charge, no spam. I'm happy to post my spreadsheet - as soon as I figure out how. I never look at the seasonally adjusted data, just the raw data, and it took me a couple of hours on tuesday to figure out why the media was reporting a positive number when the data showed the opposite.
 
I never look at the seasonally adjusted data, just the raw data,

Yeah, but those adjustments are done for a reason.

Shiller himself said on April 1 that "housing price increases on a seasonally adjusted basis are an encouraging sign".
 
Interesting. Could you tell me where to get this information? What I have encountered seems to have a positive spin put on it, so I haven't been aware of this renewd downward movement.

Ha

Also see here, particularly for a Seattle-area spin on the data.
 
The data is here S&P | Case-Shiller | United States Comes in excel format.
Registration required, no charge, no spam. I'm happy to post my spreadsheet - as soon as I figure out how. I never look at the seasonally adjusted data, just the raw data, and it took me a couple of hours on tuesday to figure out why the media was reporting a positive number when the data showed the opposite.

Thank you Michael.

Ha
 
Also see here, particularly for a Seattle-area spin on the data.

Thanks Birdie. That is really extra helpful to me, as I am only looking in about a 120 degree Northeast and Northwest sector of a 1 to 1.5 mile circle centered on 1st and Pine.

BTW, have you noticed how many ERs are in Seattle and in Washington in general? It seems that for our moderate population we have a lot of members.

Ha
 
Yeah, but those adjustments are done for a reason.

Shiller himself said on April 1 that "housing price increases on a seasonally adjusted basis are an encouraging sign".
Seasonal adjustments are done to reduce volatility and can distort at extremes - like the one we are seeing this month. See here Case-Shiller Housing Price Index: The Seasonal Adjustments -- Seeking Alpha

The monthly data was somewhat ambiguous. Looking at 3 month rolling average, the rate of decline fell sharply 'till mid year, became positive and improved through the 3Q. The rate of change is now declining, still positive in some areas, negative in others, but falling in 18 of 20 areas.

Edit: GFG - I don't mean to sound aggressive. Certainly Case Shiller know more about housing and statistics than I do, you probably do as well. One month or two may have little meaning, but now almost half a year with prices either stabilizing or declining. I think this is too significant to be explained away by seasonal adjustments.
 
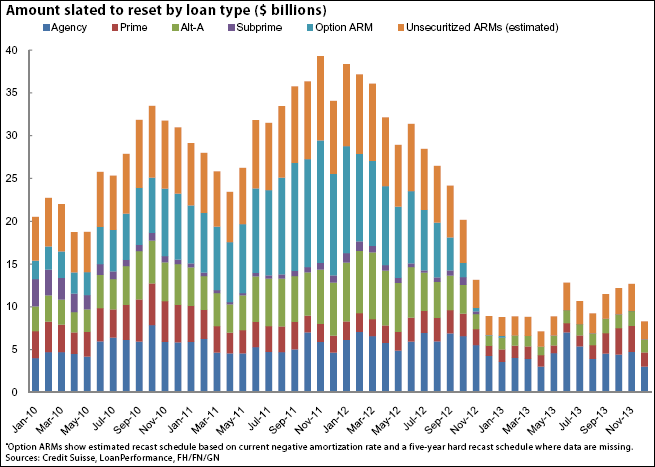
The real question is will there be a double dip caused by Alt-A and ARM Resets. Or from the growing inventory of "mark-to-make-believe" housing inventory on the banks' balance sheets (over due on payments but not in yet in foreclosure proceedings).
 
The real question is will there be a double dip caused by Alt-A and ARM Resets. Or from the growing inventory of "mark-to-make-believe" housing inventory on the banks' balance sheets (over due on payments but not in yet in foreclosure proceedings).

Yes, John Hussman has written about this.

Ha
 
The real question is will there be a double dip caused by Alt-A and ARM Resets. Or from the growing inventory of "mark-to-make-believe" housing inventory on the banks' balance sheets (over due on payments but not in yet in foreclosure proceedings).
Exactly. Even if a double dip is not in the cards, the negative equity and pending resets still point to a large number of impaired homeowners - a real economic anchor.
 
The real question is will there be a double dip caused by Alt-A and ARM Resets.

Has anyone seen an updated chart on this? The only ones I've seen are lifted from a Credit Suisse report released three years ago. How many of these have already defaulted or been refinanced?

Also, one of the big problems last time was that the resets coincided directly with a peak in the Fed's tightening cycle. So ARMs that were locked in when the Fed was at 1% were reset when the Fed was at 5%. But loans resetting this year with an inital 5-yr fixed term are going from a 3-4% Fed Funds rate in 2005, to 0% now. I also understand that the Alt-A loans don't have the negative amortization and interest only payment option features of the option ARMs so the resets don't automatically increase payments like most of the POA did.
 
This posting claims to have an SNL Interactive: Articleupdated chart:


9085247.gif
 
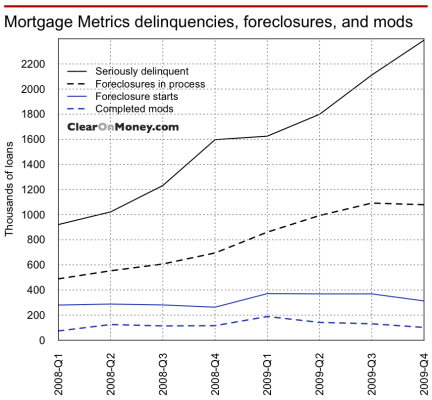
Here is the chart showing the growing "Mark to Make Believe" shhowing that the banks are delaying foreclosures to avoid imparing their assets.
 

Attachments

  • mark-to-market.png
    mark-to-market.png
    88.6 KB · Views: 2
Here is the chart showing the growing "Mark to Make Believe" shhowing that the banks are delaying foreclosures to avoid imparing their assets.

Pretty clear.
 
Here is the chart showing the growing "Mark to Make Believe" shhowing that the banks are delaying foreclosures to avoid imparing their assets.

Because so many of these mortgages have been securitized and are in companies mark-to-market books, as opposed to their accrual book, I'm not sure this chart shows what you think it does. Commercial real estate is a different story.

But even if the marks are bad, we know they are better than they were in 2007 (with billions in charges already taken). We also know that bank capital ratios are much better than they were in 2007 and leverage in the "shadow banking system" is at least half of what it was. Is it enough? I don't know, but I do think the worst is behind us for the banks.
 
The worst may be over for the banking sector, but not necessarily for all the banks. Housing prices overall are below the point when the crisis first hit, so the collateralized mortgage securities on their books may still be overvalued compared to a year ago. Real estate credit, both commercial and residential, was the cause of the financial crisis and prices have declined since then. Historically, housing prices rise along with employment. I'm not pessimistic, I believe the economy and housing have seen the bottom or are very close, but I also see no evidence of a trend upwards.
 
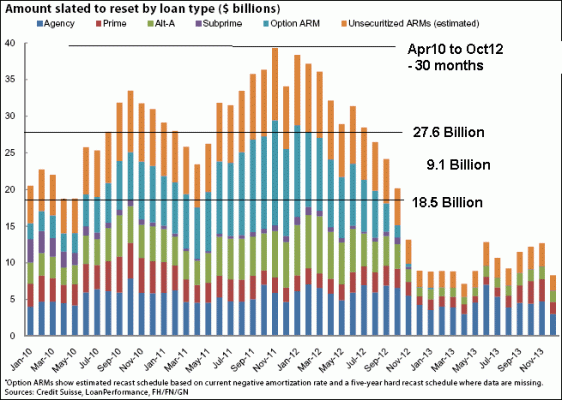
If we try to size the next bubble, there are an average of $9.1 Billion in mortgage resets bubbling up between April 2010 and October 2012. That would be 30 months of bubble for a total of 30x9.1 = 270.3 Billion of bubble. So the question is: How much of that bubble will turn bad and can the banking system absorb it all? How much has already been written down, if any? What will this do the fragile real estate recovery?
 

Attachments

  • HousingBubble#2.gif
    HousingBubble#2.gif
    29.8 KB · Views: 0
If we try to size the next bubble, there are an average of $9.1 Billion in mortgage resets bubbling up between April 2010 and October 2012. That would be 30 months of bubble for a total of 30x9.1 = 270.3 Billion of bubble. So the question is: How much of that bubble will turn bad and can the banking system absorb it all? How much has already been written down, if any? What will this do the fragile real estate recovery?

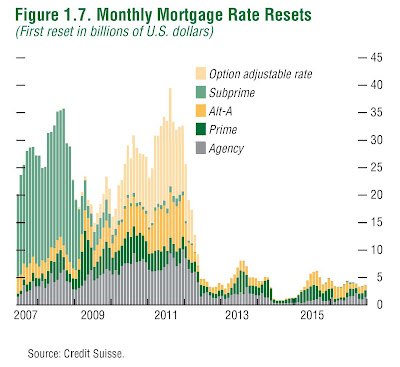
I don't think anyone knows. But if you look at the older chart, you'll see that sub-prime was as large as the Alt-A and Option ARM stuff combined . . .

IMFresets.jpg


Mitigants to the the next wave of resets are several. Credit quality is generally better. Interest rates are lower. Bank capital ratios are stronger. Leverage throughout the system is lower. Some of the worst of these loans have already defaulted. Banks carrying values have to be lower than they were in 2007.

Meanwhile, unemployment at 9.7% means that some of these loans that were made to good creditors are less good now.

Personally I think the combination of better capital ratios for the banks and lower carrying values means that we're in much better shape to deal with this then we were in 2007. That doesn't mean the housing market isn't going to suck wind for some time to come, though.
 
Bloomberg update

Bloomberg article here Housing Market May Not Be That Weak, Shiller Says: Tom Keene - Bloomberg.com reporting that Shiller has moderated slightly his previous tone
“The indicators have turned up, so my case has weakened a bit,” Shiller said. “While home price increases began to slow in November, they haven’t declined on a seasonally adjusted basis. We’re kind of in a holding pattern, where it’s very hard to tell.”
He has gone from "I think housing prices will continue to decline" to "I'm not sure".
 
Back
Top Bottom