Osprey
Recycles dryer sheets
- Joined
- Jul 28, 2016
- Messages
- 144
Forbes Welcome
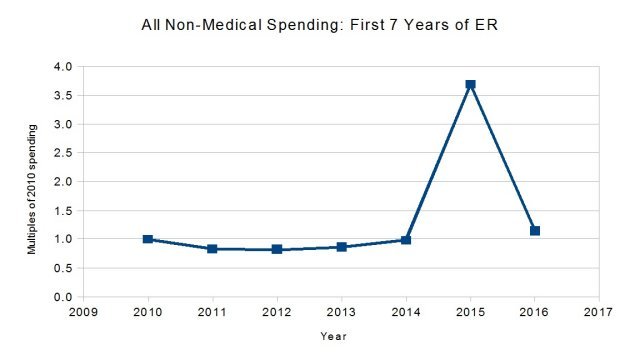
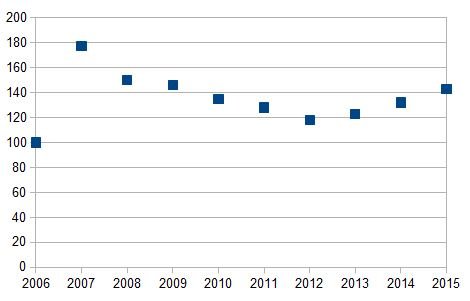
Article raises possibility that a higher withdrawal rate at outset is sustainable since as we age expenses will likely decline for a period before rising due to health care costs.
Sent from my iPad using Early Retirement Forum
Article raises possibility that a higher withdrawal rate at outset is sustainable since as we age expenses will likely decline for a period before rising due to health care costs.
Sent from my iPad using Early Retirement Forum