Is the Bull Market really 5 Years Old?

Recently I was trying to answer the question for myself "what were poor months like in bull markets?". I created a chart using monthly data which I'll share but don't be too critical please as it wasn't intended for general viewing.

Here is an explanation:
1) The SP500 (black) is adjusted every so often to keep it on the chart using the log right side scale. What is important is the jogs, not the absolute heights.
2) The RED bars are "corrections" of worse then -5%. These percentage moves are using the left hand scale.
3) The LAVENDAR bars are minor bad months, between 0% and -5%.
4) Notice there are no good months shown (positive return months) as this is just about decline months in long term up markets.
5) The dark blue bands (noted as "in Treasuries") are areas I did not analyze (bear markets) for reasons I won't get into. Again this is chart is just to show bull market bad months.

21eqf4z.jpg
 
My memory is kind of fuzzy about 2011 but I believe the market had been going down quite a bit in 2 or 3 months time up to and including October 2011. When I use the term intraday it means a point of reference during the trading day before closing...

I must be getting old, as my memory is fuzzy too. However, I have my diary logging daily close values of my portfolio to rely on. What I found was this.

In late 2010, I already recovered to the old personal high water mark in Oct 2007, while the S&P was only 78% of its corresponding high. I was beating the index soundly due to foreign stocks. Both my portfolio and the S&P continued to climb up slowly for the next 6 months, then all hell broke loose. There was a big political debate then, if my memory serves, but I cannot remember what it was about.

The market dropped big the month of Aug 2011, then continued to be very volatile for the next 6 months. See the graph below that shows Dow Jones (DJI), the S&P 500 (SPX), and the NASDAQ (CCO).

 
When was it that we had that fiscal cliff scare? It doesn't seem all that long ago, but my memory is getting fuzzy. I'm a government contractor, so I remember them starting to put into place plans to make the gov't people turn in their laptops, iPhones, etc. But then at the last minute, it never happened. I'm guessing that was sometime in 2012? Looking at my records, there were no major downturns that year, other than a quick ~5.8% snap in June (I recovered fully by August), and a ~1.2% drop in October.

Now, the furlough in October 2013 was pretty much a non-event, for me at least. I remember them sending us home on October 1, which was a Tuesday I think. We were off the rest of that week and all of the following week, and came back to work on Thursday of the 3rd week. I ended up seeing a ~3% gain for that month, overall.
 
Interesting (but not terribly useful) tidbit from CNBC this morning: it has been over 1,000 days since we've had a 10% correction.
 
I have told this before, but yesterday going to the lumberyard, I saw so much activity. Restaurants and diners along the highway have many cars in their parking lots. It was nothing like 2 or 3 years ago. This neck of the wood of my boonies retreat is an area that lives on weekenders spending money on their 2nd homes, which are more expensive than the locals can afford. People are feeling rich and spending money.

I think the market will continue to go up some more. The VIX is so low. Perhaps people who are late to the game just now pull their cash from under the mattress and start to bid up stocks. The market P/E is not cheap, but not yet at outrageous levels.

I will wait a little more before I start to write some covered calls. The ones I wrote are now deep in-the-money, and I am regretting it. Greed, I know. Hence, I try to nurture some fear to cancel that out, which hopefully will get me to see clearer. I have won and lost a 7-figure number repeatedly, with more win than loss else I would not be here. And I trade much less than many MF managers. Fun, fun, fun...
 
Yes.

No, I take that back. From top to bottom, meaning losses, I have not lost more than $1M. But from bottom to top, meaning winnings, I have won more than $1M more than once.
 
Why? There are a lot of people here with more money than I have, I am sure.

My portfolio just happens to be more volatile. I like to live dangerously. :)

By the way, top of market to the next bottom, I have not "lost" $1M, but far more than $500K. It hurt like crazy to see that money go, but I kept telling myself it was the house money. I've got to keep on playin'.
 
Last edited:
Nah, these guys are multi-decamillionaires, while I may never see that 8th figure.
 
You're in trouble now NW-B. We'll be watching you more carefully. ;)

Why? To see my "moves"? :) I have not been doing that well since mid 2011.

I repeatedly called "buy, buy, buy" at the market bottom in March 2009, and the posts are still there in the archive. I bought foreign and basic material stocks which beat the pants off S&P in 2009 till mid 2011. Then, they stumbled and I have lost ground since.

Here. Let me show it to you. Hold on.

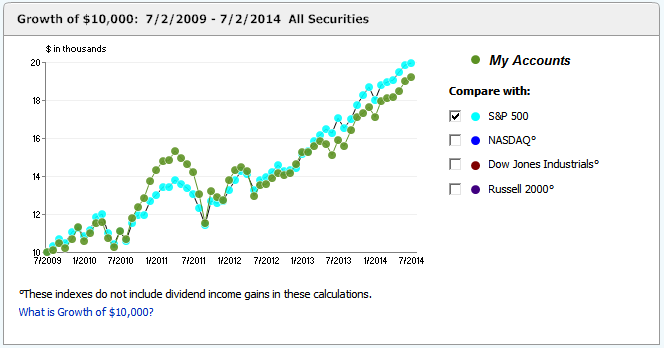
This Quicken chart shows what I was talking about, when I said I beat the S&P in early 2011, but then gave up that gain. I did not trade often enough. Since then, the S&P has been beating me. However, I am only 70% in the market, with only 5% bond and 25% cash which did little to help.

Note that the plot of the S&P does not include dividend, but my plot is after WR, which is higher than the S&P dividend. So, I am doing OK, but not great.

 
Last edited:
Why? To see my "moves"? :) I have not been doing that well since mid 2011.

I repeatedly called "buy, buy, buy" at the market bottom in March 2009, and the posts are still there in the archive. I bought foreign and basic material stocks which beat the pants off S&P in 2009 till mid 2011. Then, they stumbled and I have lost ground since.

Here. Let me show it to you. Hold on.

This Quicken chart shows what I was talking about, when I said I beat the S&P in early 2011, but then gave up that gain. I did not trade often enough. Since then, the S&P has been beating me. However, I am only 70% in the market, with only 5% bond and 25% cash which did little to help.

Note that the plot of the S&P does not include dividend, but my plot is after WR, which is higher than the S&P dividend. So, I am doing OK, but not great.


The S&P 500 is the one benchmark Quicken shows that does include dividends. No footnote mark on it.
 
...
This Quicken chart shows what I was talking about, when I said I beat the S&P in early 2011, but then gave up that gain. I did not trade often enough. Since then, the S&P has been beating me. However, I am only 70% in the market, with only 5% bond and 25% cash which did little to help.
...
Hmm ... he doth protest too much, methinks. :)

That is a weird way to benchmark if I'm understanding you. Comparing a 100% equity versus a balanced portfolio less withdrawals? Still I'm guessing you did quite well, nice going NWB.

For myself, over the last few years I've compared my portfolio to (1) an index based portfolio, (2) a Wellington based portfolio. Both of these benchmarks include some fixed income components that realistically have to be kept -- ibonds, cash, short term bonds.
 
Last edited:
The S&P 500 is the one benchmark Quicken shows that does include dividends. No footnote mark on it.

Thanks. I never noticed that.

Hmm ... he doth protest too much, methinks. :)

That is a weird way to benchmark if I'm understanding you. Comparing a 100% equity versus a balanced portfolio less withdrawals?

I do not want to make it too easy on myself. Why be an active investor just to match the S&P? :cool: Well, if I just match it on the way up, but lose less than it does on the way down, I am happy too.

And well, my portfolio is not really balanced, as I have not spent that much time studying bonds, and felt more comfortable with cash.

For myself, over the last few years I've compared my portfolio to (1) an index based portfolio, (2) a Wellington based portfolio.
I have been eyeing some balanced funds, with the idea of retiring from active investing and trusting them with my money. One of these days, but not yet...
 
...(snip)...
I have been eyeing some balanced funds, with the idea of retiring from active investing and trusting them with my money. One of these days, but not yet...
I feel the same way. Part of the reason I mentioned getting a well thought out benchmark portfolio together is to watch it over several years. I usually check things at the end of each quarter and have done this for about 3.5 years now.

I'm impressed that these benchmark portfolios are not that far off and sometimes beat my brilliant portfolio. Tends to humble one. :blush:
 
I have had the potential to "win" 6, 7 figures in the market but have always chickened out and sold early.

Recently I was in Gilead call options when it dipped down to $65 a few weeks back. I loaded up on August $70 calls dirt cheap but sold them much too early. I made $20,000 but today they are worth $600,000.
 
Here is an article from today's G&M looking at 10 leading indicators of the end of a bull market. Nine of them are adverse.

Is the bull market over? Signs are not encouraging - The Globe and Mail
After a market goes up for a while certain things happen related to the rise, such as those "signs" in the article. They are measures of the past not the future.

Years ago I regressed a number of "indicators" I don't remember all of them, things like put/call ratio, and other "sentiment" measures against the past and future changes in the market. As you might expect all of these measures were correlated to past market changes (decreasing with time before present), the future correlation was zero.

All of changes in these measures

1. Is there a surge in individual investor participation in the markets?
2. Is there a significant increase in the use of margin debt?
3. Do we witness a sharp rise in IPOs and merger activity?
4. Do the stock prices of low-quality companies reach new highs?
5. Is the media bullish?
6. Is the Fed providing or withdrawing liquidity from the markets?
7. Are interest rates expected to decline or rise?
8. Are profit margins at a cyclical bottom or peak?
9. Are valuations extreme?
10. What does CAPE signal about the future?


can be explained by what has happened to the market in the past. None of them say anything about the future. As markets go up people get increasingly optimistic, as they fall the get increasingly pessimistic.

It is natural to think that somehow this rise in optimism or pessimism can foretell something about the future, but it doesn't (we would all be rich if it did, or maybe none of us would be, because we would all be doing the same timing thing, ergo no salami). The changes in these measures can be completely explained by what has happened in the past.

I have often thought I should re-run that experiment, but after I did it, it seemed so obvious, and I am basically lazy.
 
...
I have often thought I should re-run that experiment, but after I did it, it seemed so obvious, and I am basically lazy.
Good points but maybe I'm biased being from California? :)

So often I find that the article writer is the lazy one. They do not present a multi-decade set of data to show how good a predictor their model is. But that would be real hard work and those writers have deadlines to meet, more articles to write, etc.
 
After a market goes up for a while certain things happen related to the rise, such as those "signs" in the article. They are measures of the past not the future.

Years ago I regressed a number of "indicators" I don't remember all of them, things like put/call ratio, and other "sentiment" measures against the past and future changes in the market. As you might expect all of these measures were correlated to past market changes (decreasing with time before present), the future correlation was zero.

All of changes in these measures

1. Is there a surge in individual investor participation in the markets?
2. Is there a significant increase in the use of margin debt?
3. Do we witness a sharp rise in IPOs and merger activity?
4. Do the stock prices of low-quality companies reach new highs?
5. Is the media bullish?
6. Is the Fed providing or withdrawing liquidity from the markets?
7. Are interest rates expected to decline or rise?
8. Are profit margins at a cyclical bottom or peak?
9. Are valuations extreme?
10. What does CAPE signal about the future?


can be explained by what has happened to the market in the past. None of them say anything about the future. As markets go up people get increasingly optimistic, as they fall the get increasingly pessimistic.

It is natural to think that somehow this rise in optimism or pessimism can foretell something about the future, but it doesn't (we would all be rich if it did, or maybe none of us would be, because we would all be doing the same timing thing, ergo no salami). The changes in these measures can be completely explained by what has happened in the past.

I have often thought I should re-run that experiment, but after I did it, it seemed so obvious, and I am basically lazy.


Very intriguing and insightful to me. I have also "felt" this is the reality. Nice to have your empirical analysis, even as a single data point.

I always find it fun to confuse my colleagues when there is inside company info discussed and then someone states the obvious caution, "don't trade the company stock." With a straight face I ask, "so should I buy long or short the stock?"

Like stocks really move on singular correlation. LOL
It amazes me how many very smart people are completely clueless about investing and the market.


Sent from my iPad using Early Retirement Forum
 
Back
Top Bottom