Let's brag about mid-year performance!

Well lets see...the house I bought is up 8% in the three months since I bought it.

The rest of it is up about 9.28% YTD.
 
Oh, that kind of performance.

Whatever the S&P did, minus a few basis points for the nice folks in Malvern, PA.

2Cor521
 
"Well lets see...the house I bought is up 8% in the three months since I bought it."

My house is only up 5.25%*. In the last 30 days! Ha! That's 85% on an annual basis. Beat that silly index fund investors!**


*according to zillow.com, which is slightly more useful than an 11 millimeter long centimeter.

**sarcasm. I don't really care if you can beat an annualized rate of 85%/yr during 1 month.
 
Last edited:
this is a estimate because it assumes all your deposits were on
7/2/7, some of that 8.4% is from your deposits, but its close
enough.
:)

thanks teejayevans!

that was the factor i was wondering about, but i guess it's not that big a deal.

my REIT is diving... was hovering flat for a while, now it's neg 4% in the last month and i think more over the past 3 mths. but that ain't nothin compared to the neg %'s i saw when i started contributing, in 2001 ha!

otherwise i'm split between large, mid and small value index funds and int'l...

i'm young so i'm just sitting tight for now... buy low buy low :cool: right? :confused: :uglystupid:
 
Awww, i'm just going by the sales price last month of the exact same model house, in worse current condition, on a lousy smaller lot of land that sold for 8% more than I paid and have invested in the place.

Now, another one on an even LOUSIER lot is listed at 13.5% more than I have in the place. So my return might go up quite a bit in a month or two...
 
7.53% I'm in an L2040 Lifecycle Fund. I'm going to do some rearranging next week to get more international exposure. Gotta do better than that.
 
7.53% I'm in an L2040 Lifecycle Fund. I'm going to do some rearranging next week to get more international exposure. Gotta do better than that.
fyi: REITs were number 1 performing class last year, and been in top
1 or 2 for last 5 out of 6 years.
There is probably a lot of people that said the same thing you did about
REITs .
International has been 1 or 2 for last 4 years.
caveat emptor.
TJ
 
I do not have all of the numbers yet (missing a statement). But... It looks like approx 10%.
 
14.7% YTD...92% domestic stocks, and 4% foreign...4% misc...never checked it until today.
 
15.4% YTD in my 401(K)

Holdings:
45% Domestic Equities
50% Foreign Equities
4% Short Term
1% Other

(DW's 403(B) is all Bonds. Not sure on her return yet.)
 
through 7/3 ... 8.17%, 64.7% equities
 
YTD performance

In 401K, 12.1%
64% Domestic Stocks
23% Foreign Stocks
7% Bonds
6% Short Term
Not bad so far! I'll take it. :cool:
 
I have a question,

which return do you guys report? The actual YTD (%) return or the Average annual return (%) YTD? Depending on where you get your data from (Quicken, mutual fund company, FA's statement...), the numbers reported might not be comparable.
My overall YTD (%) return is 8.2% but my Average annual return (%) YTD is 13.5%. I know the difference between the two, but which one are we using on this board?

I hope everybody is reporting the YTD, that is up to today, AND NOT THE ANNUALIZED %age which is an extrapolation of the last 6 months.

FarmerEd, ExtinctBird, and Dessert: Your numbers are truly impressive. Congrats.

Oh, that kind of performance.
2Cor521

:D Feel free to start another thread bragging about the other kind of performance. It should be entertaining!
 
Last edited:
I guess some here won't believe me, but 1H return is 71%

about 90% is in HK. Mostly micro and nano caps. Big exposure to real estate stocks.

10% is in micro and nano caps in the US

I was very lucky this year. In the future I aim to 20-30% a year
 
I do not have all of the numbers yet (missing a statement). But... It looks like approx 10%.

Mine is YTD... Plus I am allocated @ 70/30. We are a little heavy on the large cap allocation in equities. Plus, we have a substantial $ amount about 14% of the portfolio in DW MegaCorp profit sharing plan (that cannot be sold). On a Total return basis, that stock has declined a small amount (YTD).

All in all, If I can hang on to the 10% this year... I will be happy. Like everyone else, I want all I can get from the market... but my projections show me hitting my target ER amount in 4 years @ at a little less than 7%. :D. Now that I have about 10 Years of Withdrawal $ in fixed, any normal market correction or bear for several years should not upset my plans.:D

Oh... and by the way! :D

ARGHH... This limit on number of smilies is limiting my creativity! :(
 
OK, if you do this, you must tell us what your benchmark did.

I don't know absolute numbers yet, but my portfolio is mostly index funds, whose benchmarks are, um, themselves. My individual stocks seem to be up a couple percent against their benchmark index YTD, but I suspect that is statistical noise. Haven't figured out a good benchmark for my individual bonds yet -- hmm, sounds like a good project.

But overall, my portfolio pretty much is its own benchmark.
Look ma, no tracking error!
 
I have a question,

which return do you guys report? The actual YTD (%) return or the Average annual return (%) YTD? Depending on where you get your data from (Quicken, mutual fund company, FA's statement...), the numbers reported might not be comparable.
My overall YTD (%) return is 8.2% but my Average annual return (%) YTD is 13.5%. I know the difference between the two, but which one are we using on this board?


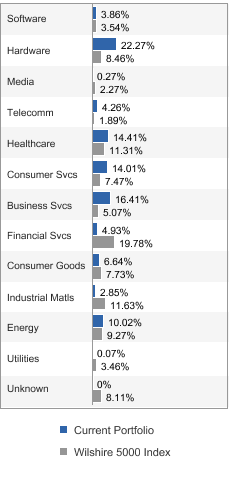
My 14.7% is YTD...annualized it would be 29.4%...now wouldn't THAT be nice...:)..here is how mine is broken down by category:
 

Attachments

  • g.png
    g.png
    18.9 KB · Views: 12
For Quicken and MSMoney users, one must use the reporting dates or period 1/1/2007 to 12/31/2007 to get the proper YTD return. If you use 1/1/2007 to say 7/3/2007, then the percent return is much higher.

An article on figuring out a good benchmark is found in the WSJ: Better Ways To Measure Your Portfolio - WSJ.com
 
For the first time since I started my asset allocation model (in 2000), I'n lagging the S&P 500. I'm currently at about 5.6% in my largest rollover IRA.

I'm getting killed by the 10% I have in REITs (down nearly 10% YTD), and the 20% in short term bonds are basically flat (up about 1.5%). The only asset classes beating large cap domestic in my portfolio are the internationals, largely due to the tanking dollar -- all of those are up in double digits.

Still, I'm not complaining; I was down only 5.4% in 2002 with this asset mix as the S&P fell 22%. And I've beaten the market every year, as I said, since I began this allocation model. It's overdue to mean-revert, though, which means large cap domestic has finally stopped underperforming, which will likely put my streak of 'beating the index' into the history books.

My 401K, though, is up about 8.5%.
 
Being arithmetically useless and spreadsheet shy, I calculated the return from various portions of out NW. FWIW our holdings are about:

25% DC pension fund
20% real estate (house, condo, farm land)
25% one big stock holding
20% diversified stock portfolio (mostly Canadian)
10% cash

Results are:

DC pension 5%
RE (boom on in western Canada) ~15 - 20%
big stock holding 46%
diversified stock portfolio 9%
cash 1.8%

All calculations use in C$, our American holdings have been clobbered by the rise of the C$. Since we don't include the RE in SWR calculations, I have no idea what this all means other than I should reduce the big stock holding.
 
For Quicken and MSMoney users, one must use the reporting dates or period 1/1/2007 to 12/31/2007 to get the proper YTD return. If you use 1/1/2007 to say 7/3/2007, then the percent return is much higher.

Just to give you an idea of the difference that the date makes, I generated a report with MS Money "Performance by Investment Type".

If I pick "Year to date" which is 1/1/2007 to 7/4/2007, it reports 18.5% as the "Annual % return".

If I pick "Current year" which is 1/1/2007 to 12/31/2007, it reports 8.9% as the "Annual % return".

If I pick "Last 12 months" which is 8/1/2006 to 7/4/2007, it reports 22.2% as the "Annual % return".
 
Now we know why a lot of whizbangy funds, newsletters and 'systems' report great results...starting in 2002 or 2003...
 
Using the 1/1/2007 to 12/31/2007 date range, the annual % return for my overall portfolio is 8% which is close to the 8.2% YTD return I approximated from Quicken's "investing activity" report..
 
Back
Top Bottom