New Month- -Same Old Chart

JPatrick

Thinks s/he gets paid by the post
Joined
Jun 3, 2005
Messages
2,610
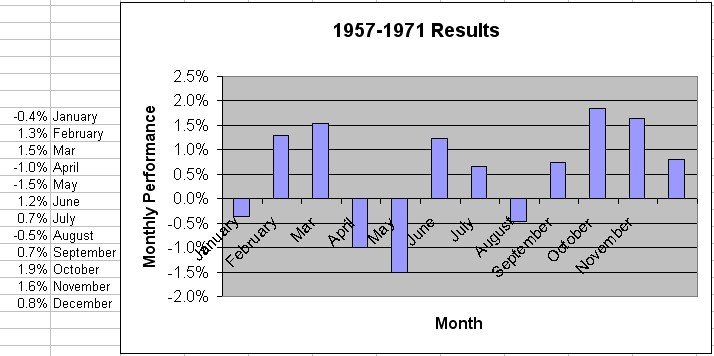
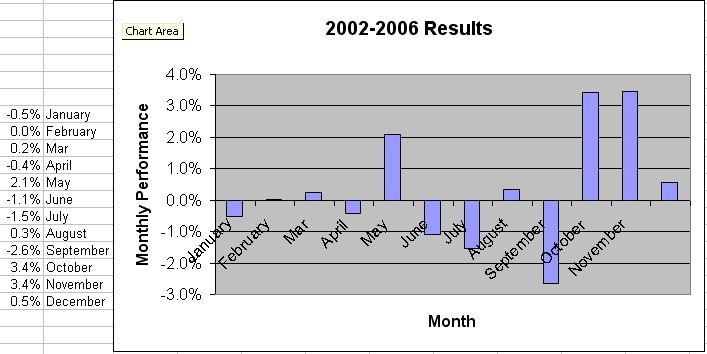
As we approach the end of each month I drag out old reliable for inspiration.  The numbers are not really important - it's the trend.  Almost any series of years you crunch (at least 15 years provides the same trend).
It is effective in at least two ways.
1.  If the trailing 3 to 6 months are in line with the chart, the possibility is strong that the next month will follow suit.  If the numbers are off, all bets are off for the short term.

2. For those struggling with the age old question=Lump sum or a little now, a little later, this is a decent macro timing tool.

Anyway, based on this chart and the past few months, I'd bet on a weaker March.  A gain would be nice, but a break even may end up being a gift.
img_366540_0_d360aae39952e5f7310788892fc4d558.gif
 
Thanks for posting this. I'd been sort of curious to see what a chart of this would look like....now I know!
 
I can understand the January effect as people pile in new money for IRAs and such. March doesn't do much as people scramble to pay taxes.

I don't quite understand the Septmember, October effect. Perhaps that also is a tax induced effect.


And it goes without saying, that these are average returns over a long period. The variance is huge and that your milage may vary.

When trying to match patterns to wildly varying numbers you'll likely find that the variance of your patern match estimate is larger than the differences in the numbers you'll base your decisions on. In other words and in my opinion any match or partial match is only a coincidence. I would not suggest that you deploy any "real" money based on a perceived pattern match.
 
Not sure how much that chart is worth.

Here's a chart summarizing monthly returns during the 2002-2006 period (based on the S&P500, not including dividends). This period is not in the sample which produced the results above. Radically different results.

I recall reading a research report from Vanguard saying essentially the same thing - historical results are moderately useful at predicting returns in sample, but when applied to out of sample periods, the historical results are not useful.

Based on the first chart, you'd assume January was a dead ringer for high returns and that October and May weren't as hot.

If you invested based on this assumption starting in 2002, you'd have been wrong. You would have missed the good months and been invested in mediocre months.
 

Attachments

  • 02-06 results.jpg
    02-06 results.jpg
    55.6 KB · Views: 157
  • 02-06 results.jpg_thumb
    10.4 KB · Views: 0
justin said:
Not sure how much that chart is worth. 

Here's a chart summarizing monthly returns during the 2002-2006 period (based on the S&P500, not including dividends).  This period is not in the sample which produced the results above.  Radically different results.

I recall reading a research report from Vanguard saying essentially the same thing - historical results are moderately useful at predicting returns in sample, but when applied to out of sample periods, the historical results are not useful. 

Based on the first chart, you'd assume January was a dead ringer for high returns and that October and May weren't as hot. 

If you invested based on this assumption starting in 2002, you'd have been wrong.  You would have missed the good months and been invested in mediocre months. 
Which is why I said 15 years- - -Show me some 15 year periods that look like your 5 year chart. It is also why I noted this==If the trailing 3 to 6 months are in line with the chart, the possibility is strong that the next month will follow suit.  If the numbers are off, all bets are off for the short term.
 
Here's 1957-1971 (a random 15 year period - excludes dividends cause Yahoo don't give em to me). Doesn't look like either of our two charts that we already posted. To me it looks like a lot of random noise.

Not sure how to test your assertion that "If the trailing 3 to 6 months are in line with the chart, the possibility is strong that the next month will follow suit. If the numbers are off, all bets are off for the short term." Do you use 3 months or 6 months or just eyeball it? How close is close enough? Your system seems to be defined with a sufficient level of flexibility or fuzziness such that it always prove itself correct (a bad trait to have if one is looking for a truly predictive hypothesis).

I stand by my earlier statement - "historical results are moderately useful at predicting returns in sample, but when applied to out of sample periods, the historical results are not useful". Except in this case, the in sample results (1957-1971) don't look much like the results from the total sample (1927-2001).

But hey, if your system works for you, keep to it. Whatever helps you earn that Mustang ;)

Just for clarification, what does your chart mean for March, specifically? Returns of approximately 0.5%? Zero to 0.5%?
 

Attachments

  • 1957-1971 results.jpg
    1957-1971 results.jpg
    60.3 KB · Views: 141
  • 1957-1971 results.jpg_thumb
    10.3 KB · Views: 1
justin said:
Here's 1957-1971 (a random 15 year period - excludes dividends cause Yahoo don't give em to me).  Doesn't look like either of our two charts that we already posted.  To me it looks like a lot of random noise. 

Not sure how to test your assertion that "If the trailing 3 to 6 months are in line with the chart, the possibility is strong that the next month will follow suit.  If the numbers are off, all bets are off for the short term."  Do you use 3 months or 6 months or just eyeball it?  How close is close enough?  Your system seems to be defined with a sufficient level of flexibility or fuzziness such that it always prove itself correct (a bad trait to have if one is looking for a truly predictive hypothesis).


But hey, if your system works for you, keep to it.  Whatever helps you earn that Mustang  ;) 
How close?  I just want the general trend, numbers not even necessary.  3 to 6 months the more the better.
Despite what you may believe, I'd stay away from buying in Jan and selling in Sep/Oct as your "random" charts would seem to recomend.
 
JPatrick said:
How close? I just want the general trend, numbers not even necessary. 3 to 6 months the more the better.
Despite what you may believe, I'd stay away from buying in Jan and selling in Sep/Oct as your "random" charts would seem to recomend.

When I look at my charts, I see "sell" before January and "buy" in September for the Oct./Nov. rally. But that would make me a dirty market timer.


I guess I should have just started off by calling you a "dirty market timer" and gotten it over with. ;) That would have saved a lot of discussion.
 
Speaking of market timing, it may be good time to buy natural resources/energy funds because of the recent dip. Emerging market is also good buy despte its recent rise.
 
Spanky said:
Emerging market is also good buy despte its recent rise.

Spanky,

What makes you think emerging mkts look good right now?


I'm thinking the same thing. But the recent run-up scares me a little. Looking at P/E's and earnings growth rates, it looks very fairly valued given the risks (currency and country risks, etc.).

My gut tells me emerging mkts has more room to grow and at a faster pace than developed economies.

It fits into my asset allocation plan, so I'll probably go ahead with my planned purchases in spite of the recent run-up.
 
Jennie,

You pretty much answered the question. Emerging market is poised to perform better than the developed market despite its volatility and recent runup. It is not cheap but fairly valued (as you stated). My plan is to DCA into it and limit the exposure to 5%.

Spanky
 
Back
Top Bottom