Odd SS Payout vs Retirement Age Graph

Ian S

Thinks s/he gets paid by the post
Joined
Aug 20, 2014
Messages
1,933
Location
Red Rock Country
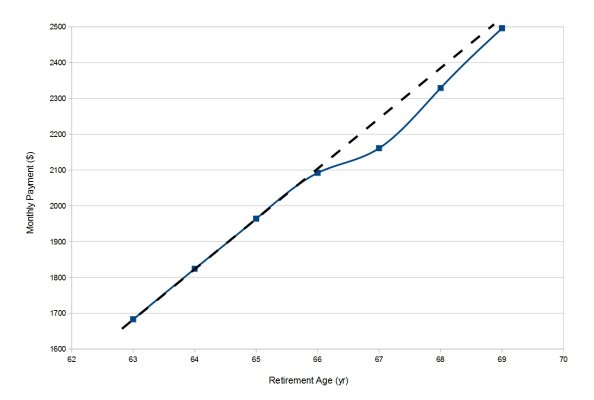
Like many, I'm looking into when to start taking Social Security and have used the downloaded ANY PIA calculator to look at various scenarios. Since I have already stopped working, I have only input that actual income amounts from my past working years up to 2014 (age 63) and nothing beyond. When I calculate monthly payments as a function of age when payments start, I get the odd behavior shown in the attached graph. There's a fairly linear increase to age 66 (dashed line) but then an abrupt curve shift to the right which means the increase in payment going from 66 to 67 is considerably less than in prior years. Has anyone else seen this behavior? Is it a quirk of the software or is there something else I'm missing e.g. improper input or setting? Thanks for any help.
 

Attachments

  • ScreenHunter_01 Aug. 29 14.42.jpg
    ScreenHunter_01 Aug. 29 14.42.jpg
    59.4 KB · Views: 97
FWIW I have noticed the same for both mine and DW's accounts. Several here study the SS formulas in detail and perhaps one will be along shortly to explain what is happening.
 
Your ss payout at 62 is discounted 25% from the full retirement age.
After full retirement age it goes up by a percentage each year-you can go to SSA.gov and look up that increase.
 
Your ss payout at 62 is discounted 25% from the full retirement age.
After full retirement age it goes up by a percentage each year-you can go to SSA.gov and look up that increase.
Well, that's true but what I'm trying to understand is why the ANY PIA calculator produces a kink in the payment vs SS starting age curve. Since Rustward has seen the same behavior, I know I'm not the only one to notice and wonder about it.
 
AnyPIA gives the following increases at zero inflation for my data between FRA and 70.

4613-albums169-picture1204.gif


So I guess the jokes on those of us who thought it was 8% per year. Something tells me it's my error from hearing what I wanted to hear and not an error in AnyPIA.
 
This is my first post here. This sounds more like an issue with the AnyPIA software. If I use the QuickCalc on the SS website and set it up for 1 year after my FRA, Early or Late Retirement. It replies with: "You choose to receive benefits 12 months after you reach your normal retirement age. Your benefit will be 108 percent of your primary insurance amount."

Below, I plotted out the SS data assuming a 1,000 FRA benefit. I wonder if it has to do with the birthday you enter and how the calculator works in AnyPIA. Funny how 1.33/8 works out to be exactly 2 months.

I am not sure what I am missing.....
 

Attachments

  • SS annual chart.JPG
    SS annual chart.JPG
    19.9 KB · Views: 22
AnyPIA gives the following increases at zero inflation for my data between FRA and 70.

4613-albums169-picture1204.gif


So I guess the jokes on those of us who thought it was 8% per year. Something tells me it's my error from hearing what I wanted to hear and not an error in AnyPIA.

Looks like it screwed up the 66 to 67 change (assuming FRA was 66 years and 0 months) and fixed it at age 70.
 
I've never used AnyPIA. The numbers posted here seem to contradict SS explanations like this one: Early or Late Retirement

I wonder if the the input for AnyPIA somehow got a start date that wasn't 12 months after NRA.
 
Dated 2010 from SSA.gov, but I don't think anything has changed:

Early or delayed retirement

It shows a chart of percentage of PIA benefit at various starting ages (except 68 and 69, so beware) versus birth year.

8%/year (not compounded) for delaying after FRA for those born in 1943 or later. FRA also affects what percentages are used for earlier than FRA starts.

Doesn't seem like that would result in the OP's graph.
 
I've been playing around with it. In the first year I collected in November 2014 which gave a factor of 1.000 (FRA) for both Nov and Dec. 2014. But in Jan 2015 I get a 2 mo. increase factor of 1.01333. It remains at that value until Jan 2016 when it gives another 8%. And so forth. In the year of age 70 (2018) it stays at the Jan factor until Nov when it sets to the full 1.32. So, in the calculator, someone who retires when first reacting FRA, receives the prior year's months in January of each year and at age 70 they get the full factor of 1.32.

That explains the initial 2 months. It incremented in Jan 2015 by two months owed from 2014, remained constant until Jan the next year, and continued to increment in Jan until the last year when it was willing to increment in Nov. (Remember Nov was the month of the FRA eligibility.)
 
...So I guess the jokes on those of us who thought it was 8% per year. Something tells me it's my error from hearing what I wanted to hear and not an error in AnyPIA.

The 8% a year that is oft-quoted only applies to growth in benefits from FRA to age 70 for those born in 1943 or later. If your FRA is age 66 and you wait until you are 70 then your benefit will be 132% of your FRA benefit. If your FRA is age 67 and you wait until 70 your age 70 benefit will be 124% of your FRA. Also note it is 8% simple and not 8% compounded.

Early or Late Retirement
Early or delayed retirement
 
Last edited:
The 8% a year that is oft-quoted only applies to growth in benefits from FRA to age 70 for those born in 1943 or later. If your FRA is age 66 and you wait until you are 70 then your benefit will be 132% of your FRA benefit. If your FRA is age 67 and you wait until 70 your age 70 benefit will be 124% of your FRA. Also note it is 8% simple and not 8% compounded.

Early or Late Retirement
Early or delayed retirement

Yes the calculator at the website gives the factors I would expect, including the monthly factors. AnyPIA gives the right numbers at the age 70 endpoint. That wasn't the issue with it's result.
 
Back
Top Bottom