Only a little under 30 points before the S&P500 hits the 200 day MA

cute fuzzy bunny

Give me a museum and I'll fill it. (Picasso) Give me a forum ...
Joined
Dec 17, 2003
Messages
22,708
Location
Losing my whump
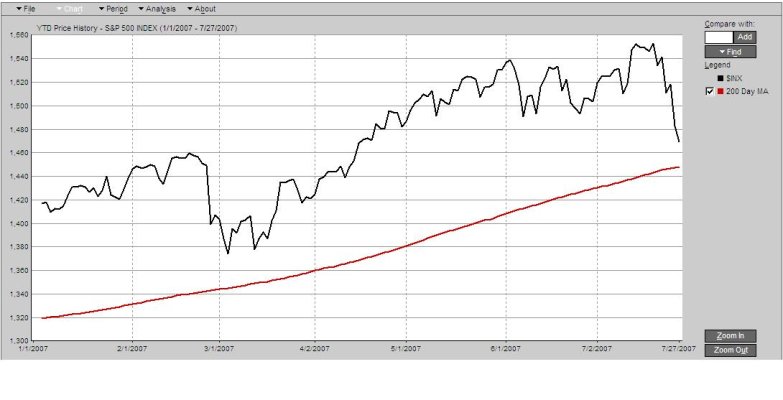
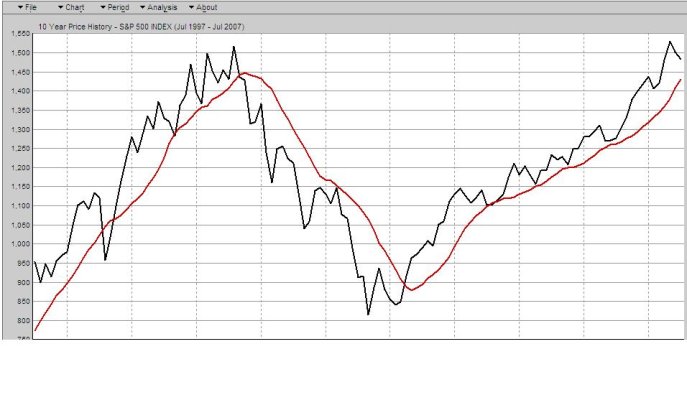
For those of you with strong, red market timing blood in your veins, with its losses today so far, the s&p500 seems headed for a collision with its 200 day moving average line.

Breaking the 200 day MA to the downside has been a pretty good predictor of when to get out (if you havent already). Breaking to the upside has been a pretty good predictor of when to get in...

But the practice DOES have its detractors...
 

Attachments

  • 200 day ma ytd.JPG
    200 day ma ytd.JPG
    70.3 KB · Views: 44
  • 200 day MA 10 years.JPG
    200 day MA 10 years.JPG
    72.7 KB · Views: 47
I've been about half out since two days before the last huge drop a couple of months back. You remember? I was a genius for a week or two? People wanted to buy my newsletter? ;)

When its fully broken the 200 day MA, and on the upside crosses over the 50 day MA, i'll be buying back in.

Thats...IF it breaks and continues to drag the average down for a while.

I'll also have a bunch of cash from selling my old house showing up pretty soon...be nice to get a little cooperation from Mr. Market...

Seriously though, seems to me in looking at that ytd chart that we peaked up in early june and all we've been getting lately is volatility.

I think this downturn is gonna keep going.
 
I just hope you appreciate the fact that I committed in writing that the downturn would continue.

This will almost certainly result in an immediate turnaround, the dow rising 1000 points in a day, and my becoming a moron again for a while.

I'd appreciate all of you who benefit from this sending me two dollars via paypal.
 
Ha ha...

Why $2? Might as well ask $20, or $200, or even more. You're not going to get anything, anyway.
 
Because almost anyone will give you two dollars if you ask them for it. Once you go over two, the compliance rate drops.

So while I technically wont get anything, at least my request was statistically reasonable.

Plus I get to run around yelling "I want my two dollars!"
Better Off Dead... (1985)
 
Breaking the 200 day MA to the downside has been a pretty good predictor of when to get out (if you havent already). Breaking to the upside has been a pretty good predictor of when to get in...
You mean "has been pretty good predictor of when to get out of the S&P500", right?

We're only 3.9% off our ER portfolio's all-time high and still up for the YTD. Berkshire Hathaway hasn't budged much, the PowerShares International Dividend ETF (PID) hasn't moved much, we've been buying the Dow dividend ETF (DVY), and Brewer's pointed out an undervalued bargain or two. Perhaps some of them correlate to the performance of the S&P500 but...

I'd buy more small-cap value, too, but I think we have enough.
 
Nobody on here has mentioned it yet (unless I missed it), but "growth is back". In the domestic large-, mid-, and small-cap arenas anyway (looking at YTD performance). International growth/value are neck and neck right now. Small cap value (overlaps with REITS) is actually slightly down for the year at this point. S&P 500 P/E's below 17 trailing twelve months.

Based on this, I'll keep dollar-cost-averaging into my asset allocation plan tilted towards value and small.
 
I added some more small cap value to my Roth more JNJ, PFE, and some regional bank shares this week to my taxable...
 
But the practice DOES have its detractors...

Not to be a detractor, but I count 4 times on your graph where the 200 dma was hit and crossed (rather than bounced). Of those 4 times, 2 were crossed and kept going down, 2 were crossed and kept going up. Mmmm,,, 50%. Oh, that 4 is out of a total of 10 200dma events, the other 6 times it bounced.
 
Last edited:
The good news is if it keeps going down I'll be too poor to afford trading fees to get out ;)

I'm amazed I'm still positive for the year after the gobs of red I've seen lately in my tracking sheets. Think I've lost about 6 or 6.5% in the last week. I'm a little sad to see the money go, but I'm sure it'll come back at some point
 
I'm in the -- "I'm not looking mode"....I've got a great weekend planned and don't want to be concerned (knowing the specifics of my losses). I am still feeling good about 07 ending well. If it keeps falling...I will be in the "buying mode".

CFB - There are over 3500 motorcycles going up the freeway tomarrow(Saturday) around 11am. I will be one of them - it is the Sacramento police memorial ride, alot of fun...and something worth seeing -- the police close the fast lane and all bikes cruise up to the fairgrounds in Placerville for BBQ and bands.
You might want to take your son to an overpass - all the bikers beep and wave for kids :>)
 
Oh, that 4 is out of a total of 10 200dma events, the other 6 times it bounced.


I think if you look a little more closely, you'll see that it rarely "bounced" right off but rather dipped under a little bit or failed to cross.

In any case, if you sold when it crossed, then bought back on the uptick, worst case you spent a couple of bucks on trades and may have made a few bucks on the gap.

The "real" mechanism, IIRC, was waiting for it to have crossed and stayed there for 5 business days before you pull the trigger.

By the way, I have absolutely no faith in this as a trading mechanism. Its just sort of interesting...in a "this always seems to work but the time I do it will be the first time it'll fail" sort of way.
 
CFB - There are over 3500 motorcycles going up the freeway tomarrow(Saturday) around 11am. I will be one of them - it is the Sacramento police memorial ride, alot of fun...and something worth seeing -- the police close the fast lane and all bikes cruise up to the fairgrounds in Placerville for BBQ and bands.
You might want to take your son to an overpass - all the bikers beep and wave for kids :>)

I wont even need the overpass...I can see a tiny little bit of route 50 from one of my 3rd story windows, and if I'm outside and a flotilla of really loud bikes goes up the highway, I can barely hear them.

So I'll wave like crazy when all y'all go by. I'll even use all five fingers, which isnt the usual. :)

With a little luck, I'll still be sleeping when you go by. Pretty dang unlikely with a 2 year old. ;)
 
If enough people follow it, it’ll become a self fulfilling prophecy.
IMHO, that the way all technical analysis works.
 
Ah, heck....I'm trying to stay in "the market goes up/the market goes down" mode......as I look toward several months in western Europe traveling this fall....sigh......and I thought the weak dollar was my biggest problem.....

Time to just sit back and trust in the allocation and rebalancing just done recently, and ride it out.

LooseChickens
 
CFB has already said he's not going to try to really sell this strategy so I'll assume it was mentioned somewhat touge-in-cheek. I've yet to see someone do a nice statistical analysis that says this has really worked in the past (200 day moving avg or whatever). You have to decide the exact sell point, the next buy point, and then do the data going way back. Even if it works despite numerous small whipsaws, so what, it's just datamining. Don't know what kind of out of sample data would help to check this either.

Regarding this, Doug Fabian (senior, not sure if he's still around) use to use a 39 week moving average on a few indexes if I recall right. It put him in one of the best performing categories for many years according to Hulbert. His son took it over and last I heard a few months ago he tinkered with it and was then out of the market -- as the market went up and up and up. The only good thing about this kind of system is that it is suppose to be purely mechanical. Sounds like the son couldn't stick to a good thing or alternatively he realized its previous success was just luck. Anybody out there subscribing to Fabian's newsletter now?

Les
 
When I look at the chart I see a classic cup-handle double-breakthrough resistance pattern. Sell! Sell! If I look at it sideways, I see a pony. Sell a pony!

When I've seen the 200 day moving average tactic discussed, I always wonder how that number emerged. Has it worked better than the 137 day or the 419 day average? What are the odds that "200 days" emerged from data mining and has now become accepted practice among chartists.
 
I used to be driven by statistical analysis. The engineer in me wanted to have it work. After several years I realized that statistical analysis is only useful to explain what happened after it has already happened. You can sound very knowledgeable. Unfortunately, it doesn't predict anything.

My portfolio tanked last week. I suspect this next week will also be "difficult." As it now stands I'm up 7.05% for the year. That's not bad for a typical YTD return in July. Unfortunately, a week ago I was up around 12%. :p
 
CFB has already said he's not going to try to really sell this strategy so I'll assume it was mentioned somewhat tongue-in-cheek.

Sort of. I look at a shitload of "indicators", "systems" and whatnot. I take these more or less as tools in the tool box.

And i'm not much of a market timer anyhow. But I do subscribe to the theory that the markets get drunk once in a while and that one or two times in your investing career you may want to take matters into your own hands.

I'm a little better off having said "holy crap, this is stupid!" in 2000 and selling all of my equities, then having bought back in in late 2002. Fortunately I was not "blessed" with that funny brain thing plugged in backwards that makes people want to buy stocks when they're expensive and sell them when they're cheap.

If everyone feels just great about owning stocks, and a bunch of indicators are all redlined in the opposite direction, and I feel things are over priced...I've been known to lighten the load a bit. I did that a couple of months ago.

If we break the 200 day MA (which simply says that we're in the midst of a strong trending downturn...people are selling)...I'll look for an opportunity to buy back in.

These sorts of threads are just little dialogs designed to get a little interesting discourse going on...otherwise i'll run out of pictures of cats with bacon on their heads.
 
I used to be driven by statistical analysis. The engineer in me wanted to have it work. After several years I realized that statistical analysis is only useful to explain what happened after it has already happened. You can sound very knowledgeable. Unfortunately, it doesn't predict anything.

I completely agree with that. If it's called analysis, it's because it was developed to analyse (and not to predict), and to analyse, you need existing data. So by definition, statistical analysis is a tool used to look backward, not forward.
 
If we break the 200 day MA (which simply says that we're in the midst of a strong trending downturn...people are selling)...I'll look for an opportunity to buy back in.

If you think about it, breaking a 200 day MA does not necessarily mean we're in the midst of a strong trending downturn. Suppose the market is treading water for quite awhile -- then it takes very little to pierce a moving average.

OK, so maybe now we have a reasonable percentage change causing the event. Ha, now we can do the historical analysis and come up with some trading rules. You could check the data trying various rules like only sell if market is down more the X% and pierces the Y day MA. Then you need another rule to get back in. All you need to do is check the market back a few decades and see which will work. Unfortuneately, it may not work the next time. Also, if you invest in a slice/dice or perhaps tilt to value or have lots of international stock exposure can you really use such rules based on one index? Maybe you need a few more indexes, and on and on and on ....
BTW, I use to do some of this so feel I'm qualified to say it isn't too smart :duh:. All this looks really appealing until you get whipsawed or miss a market turn.

CFB, my hat's off to you on the 2000-2002 trading but personally I don't think this market has the wild look of the large growth 2000 bubble -- on the other hand it has other factors that make it worriesome. I rebalanced 3 weeks ago and will stick with my stock allocation but will not rebalance into stocks unless we get a really nasty decline.

Les
 
Back
Top Bottom