There was a recent thread (I won't resurrect) that discussed a recent article claiming that the PE10 during the initial phase of retirement determines the actual 95% SWR. The premise was low PE's at retirement allow a higher SWR than high PE's.
John Greaney reviewed this data and has an interesting "rebuttal" on his website (see link).
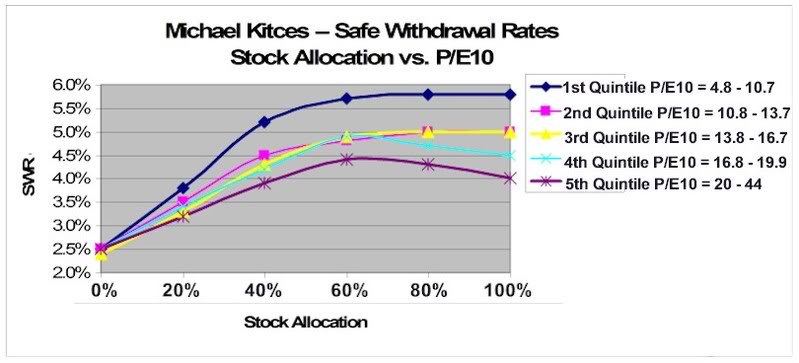
Another Look at Safe Withdrawal Rates and PE Ratios
As you can see from the first plot, there is statistical justification for the higher SWR at low PE's but the standard deviation is so large as to make the correlation almost meaningless. "On average" the thesis is supported but there are wide ranges of 95% SWR at every PE10. Unfortunately, the risk of failure is still substantial for many low PE10s with a SWR over 4%.
Another important reason to always look behind the data before jumping to a hasty conclusion.
"Figures don't lie but liar's figure." "Correlation does not determine causation." These are two important things to remember when statistics are thrown at you.
John Greaney reviewed this data and has an interesting "rebuttal" on his website (see link).
Another Look at Safe Withdrawal Rates and PE Ratios
As you can see from the first plot, there is statistical justification for the higher SWR at low PE's but the standard deviation is so large as to make the correlation almost meaningless. "On average" the thesis is supported but there are wide ranges of 95% SWR at every PE10. Unfortunately, the risk of failure is still substantial for many low PE10s with a SWR over 4%.
Another important reason to always look behind the data before jumping to a hasty conclusion.
"Figures don't lie but liar's figure." "Correlation does not determine causation." These are two important things to remember when statistics are thrown at you.
")