Vanguard correlation matrix

Well, well, well. It looks like Adobe Reader has a problem with this file. Perhaps the file is too large. I generally use Apple's PDF reader, Preview, and it works just fine. I'll see if I can't figure out why Adobe Reader chokes on it.
 
I continuously calculate the correlation between all my holdings in Excel as part of my tracking. It's not that hard to do.
 

Attachments

  • Corr.jpg
    Corr.jpg
    45.4 KB · Views: 41
I continuously calculate the correlation between all my holdings in Excel as part of my tracking. It's not that hard to do.

Interesting concept. Very nice use of colors!

Dunno what is wrong with the PDF versions and too lazy to figure it out. Here is a plain text version of the first 500 pairs.

View attachment 8392

Nice to have the raw data. I can get it into Excel from here.

Free to canoe
 
Warning:

The correlations should polly be calculated using the fractional daily NAV change instead of the raw NAV. I am still thinking about it. Will probably post updated correlations later.

Sorry, :blush:
 
My VG portfolio is all in the +0.9's. How do I use this correlation chart to get better diversification
 
My VG portfolio is all in the +0.9's. How do I use this correlation chart to get better diversification
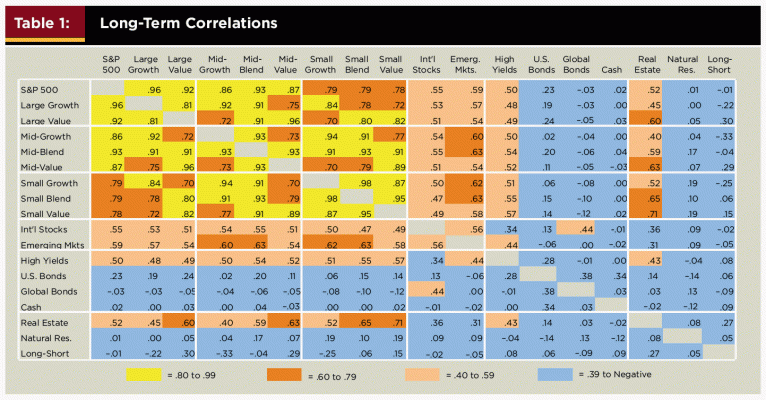
Sounds like your holdings are all large to medium stock funds. I shared my actual holdings above. But here is another chart that shows in general what's normally highly correlated and what's not. Best of luck...
 

Attachments

  • correlationchart.gif
    correlationchart.gif
    83.2 KB · Views: 105
Midpack,
Nice chart. Thanks. It seems that adding national resources, global bonds and high yield bonds provide increased diversification.
 
I continuously calculate the correlation between all my holdings in Excel as part of my tracking. It's not that hard to do.
Can you give us a peek behind the scenes, into the data and formulas that generate your chart?
Also, what is the data source for the other chart in this post?
Thanks. Interesting discussion, and I'm all ears.
 
Daily, over the longest period possible during which each pair of funds exist, so some of the correlation pairs are over much longer periods than others.

Any reason why you picked a daily timeframe? It would seem to me that for most people who are passive investors, a yearly timeframe would make more sense.
 
Ah thanks. I didn't realize this was an older thread.
 
Can you give us a peek behind the scenes, into the data and formulas that generate your chart?
Also, what is the data source for the other chart in this post?
Thanks. Interesting discussion, and I'm all ears.
Hopefully I won't regret this and I make no guarantees, but here's the Excel calcs I use to watch actual correlation on my holdings. If someone sees an error, I'd appreciate a heads up. These are all built-in Excel functions, you can research them online if needed. No $ shown and I plugged in an arbitrary AA. Best of luck.

It's not something that I need to act on, I use correlation when I am choosing holdings, and only track after that to make sure the correlation (or lack thereof where desired) is holding up within reason. It would be a mistake to act on these often IMO, there are times when everything will seem to move together for short periods, last meltdown there was no place to hide money except cash and bonds to some extent.

And here's where that other chart came from, but I just Googled for it, I've seen these several times from several sources.

http://www.doughroller.net/wp-content/uploads/2007/09/correlationchart.gif
 

Attachments

  • Correl.xls
    127.5 KB · Views: 6
I thank you folks for digging up this thread. I needed a reminder about how correlation related to diversification. Since I have just recently finished a statistics course, this actually makes more sense to me than it would have in the past.
 
Nice chart...how do i use it?

I thank you folks for digging up this thread. I needed a reminder about how correlation related to diversification. Since I have just recently finished a statistics course, this actually makes more sense to me than it would have in the past.
confused.gif

Okay, now I have this nifty chart, how do I use it?
I have:
VGHAX ADM HEALTH
VASGX LIFE STRAT. GROWTH
VWNFX WINDSOR II
VWELX WELLINGTON
VWINX WELLESLEY
VIMSX MID CAP
VFINX 500 INDEX

What correlation range do I want ?
How do get around choosing a fund that has a good correlation
with one, but not the others?

I'm feeling very dumb
 
Okay, now I have this nifty chart, how do I use it?
Everyone knows they should diversify across asset classes; stocks, bonds & cash to reduce volatility - but they may not know how/why it works.

Everyone knows that bonds and cash flucuate less than stocks and that's indeed part of it.

However, some may not realize that bonds and cash also don't typically have a high correlation with equities. Stocks often rise and fall inversely as compared to bonds, which also helps reduce volatility.

Anyone with a reasonable asset allocation is taking some advantage of low correlation - they just may not know all the ways that reduces volatility. Correlation is just a numerical comparison between your holdings relative to each other which provides and indication of overall volatility in a portfolio - it's no more mysterious than that. It's not something you MUST be aware of, most people probably aren't.

Beyond that, it can be helpful in choosing among your equity holdings to avoid holdings that are all highly correlated.

Maybe this will help The Benefits of Low Correlation - JOI Articles.
 
I continuously calculate the correlation between all my holdings in Excel as part of my tracking. It's not that hard to do.


This is really nice. Where are you getting your data from? I currently download from yahoo (via Matlab) and am looking for a better data source/query. any suggestions?
 
This is really nice. Where are you getting your data from? I currently download from yahoo (via Matlab) and am looking for a better data source/query. any suggestions?
I cut-n-paste from the Vanguard site and the Dodge & Cox site in my case. Haven't bothered to automatically query/insert for this one since I only need new data quarterly.
 
Back
Top Bottom