What are you, a miserable Boomer failure!?!?dmpi said:Except I said at 45 I'll have $2M. I hit the 500K & 1M but missed the 2M benchmark because of the dot-com bust. I did eventually hit it at about 46.5.
You are using an out of date browser. It may not display this or other websites correctly.
You should upgrade or use an alternative browser.
You should upgrade or use an alternative browser.
Net Worth Benchmarks
- Thread starter saltydog
- Start date
HFWR
Give me a museum and I'll fill it. (Picasso) Give me a forum ...
No, that would be me... 
Nords said:What are you, a miserable Boomer failure!?!?
I kept telling my DW we had to cut back so I can hit my goal. That didn't go over so well.

retire@40
Thinks s/he gets paid by the post
- Joined
- Feb 16, 2004
- Messages
- 2,670
daystar said:I just set up my own personal, achievable benchmarks. I'm 27 with a net worth of $235K.
28: $250K
35: $500K
40: $1M
40+: Who Know's?
I really like those benchmarks
What is your ER benchmark, and semi-ER benchmark, if you have one?
daystar
Recycles dryer sheets
I will probably retire between 48 and 57. This will allow me to collect a government pension that is worth 25% to 35% of my salary.
I will problably be banned for saying this blasphemy, but I'm not sure if I will ever retire early. I still get a lot of satisfaction from going to work and I don't know what I'd do with my day without working. However, I still want to be in a position where I can retire early if I want or need to.
I will problably be banned for saying this blasphemy, but I'm not sure if I will ever retire early. I still get a lot of satisfaction from going to work and I don't know what I'd do with my day without working. However, I still want to be in a position where I can retire early if I want or need to.
A lot of people find that work is more tolerable when they achieve FI. Or maybe they just enjoy backtalking the boss without fear of reprisal. ("Oh, yeah? You can't fire me, I'm retiring!!") It's also easier to cut back on the hours if you're not chasing the big paychecks.daystar said:I will problably be banned for saying this blasphemy, but I'm not sure if I will ever retire early. I still get a lot of satisfaction from going to work and I don't know what I'd do with my day without working. However, I still want to be in a position where I can retire early if I want or need to.
But as for not retiring early, you'll have to get back to us after a three-month sabbatical. Experience is worth far more than analysis...
I like making graphs...
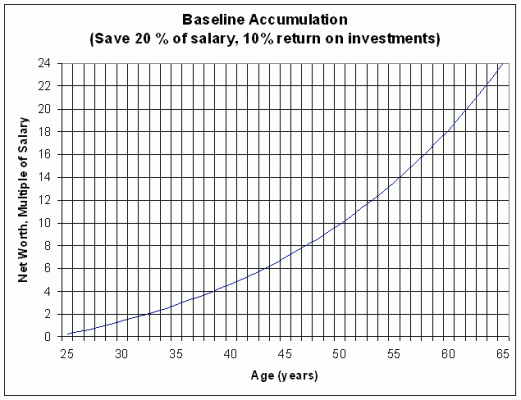
Here's one I just whipped up now.
I assumed that our benchmark person started saving at age 25. This person saves 20% of their income every year, and they get a 10% return on their savings. They also get a 5% raise every year until they retire. As you can see, this person will almost get to Savings = 25 times salary when they are 65.
So where should I be? Well, I'd look up my age (35), and see that the multiplier from the graph is about 3. So may savings should be 3 times my salary to be "on track".
Obviously, this "benchmark" has limited use because of all the assumptions. What about pensions? What if you don't get 5% raises every year? What if you get married? Its just a basic benchmark, and better than the millionaire next door formula, IMHO.
Attachments
MasterBlaster
Thinks s/he gets paid by the post
- Joined
- Jun 23, 2005
- Messages
- 4,391
Slepyhead:
Your analysis ignores the effects of inflation.
May I suggest that you re-do the calculations with 10% gains less maybe 3 % inflation for a net of 7% (real) gain. Same with tyhe raise 5% less 3% ==> 2% real.
Also as others have pointed out maybe you get a match from the employer in the 401k savings plan.
Also, do you really need 25X your current income to retire. What about social security ? Can't we take that off. There are lots of posts where people retire at 40-60 % of current income. After all you won't be saving anymore and you won't be paying SS/medicare taxes (payroll) taxes. So if we take off the 20 percent savings and the (up to) 6.2% payroll tax, we really only need to make less than 73.8 percent of what we did when we were working to stay the same. Take off another 10 percent that would go to income taxes now that your retired income is less than it was and you are down to maybe two thirds of your working income.
I suspect when you do the analysis you will have enough income out of that nest-egg to retire 25 years after work starts at maybe 50 years old.
MasterBlaster said:Slepyhead:
Your analysis ignores the effects of inflation.
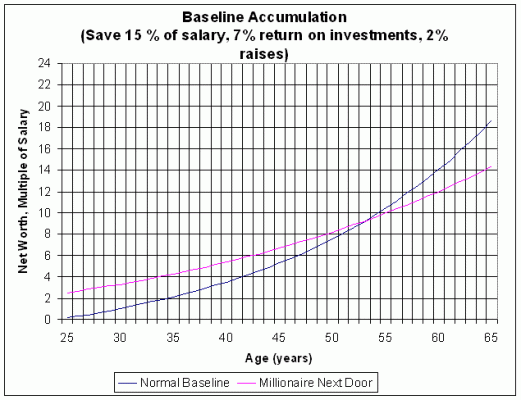
May I suggest that you re-do the calculations with 10% gains less maybe 3 % inflation for a net of 7% (real) gain. Same with tyhe raise 5% less 3% ==> 2% real
Sure! Like I said, I like making graphs.
While I was at it, I ratcheted down the savings rate to 15%. Our benchmark person ends up with about 18 times salary at 65, which might be enough to retire on with social security.
Also, I threw the Millionaire Next Door formula onto the graph, for comparison.
Attachments
jazz4cash
Give me a museum and I'll fill it. (Picasso) Give me a forum ...
I like #2 better, but I'm still a long ways off
Slepyhead:
That's a nice graph. I wish I made one when I was 25.
However I got a question. Is that 25x income of the income when your 25,
or is it 25x income at the age your looking at (like 65)?
Its confusing because your income is somewhat adjusted for inflation.
Also this graph assumes your 100% invested. Most likely true when your 25. But at 65 a 60% 40% mix may be more realistic.
dmpi said:Slepyhead:
That's a nice graph. I wish I made one when I was 25.
However I got a question. Is that 25x income of the income when your 25,
or is it 25x income at the age your looking at (like 65)?
Its confusing because your income is somewhat adjusted for inflation.
Also this graph assumes your 100% invested. Most likely true when your 25. But at 65 a 60% 40% mix may be more realistic.
The graph shows your second option - so the latest graph shows the 65 year old having 18 times his current income, not 18 times his income when he was 25.
And you're right, its not a detailed analysis. Its just a simple benchmark, and I think the point to take away is that youngsters shouldn't feel too bad if they have almost nothing. Its an exponential curve, so in the early years very little happens, but things really take off later in life.
A few more notes:
Starting to save earlier in life shifts the whole curve to the left. Waiting until later moves the curve to the right.
Changing the amount you save changes the steepness of the curve. So does changing the rate of return.
The MND curve, by comparison, is almost impossible for someone to achieve early in life. It becomes progressively easier to achieve for older people. In fact, for someone over 55, it looks to me like the MND formula would tell them that they are doing fine when they may actually off-track on their retirement savings.
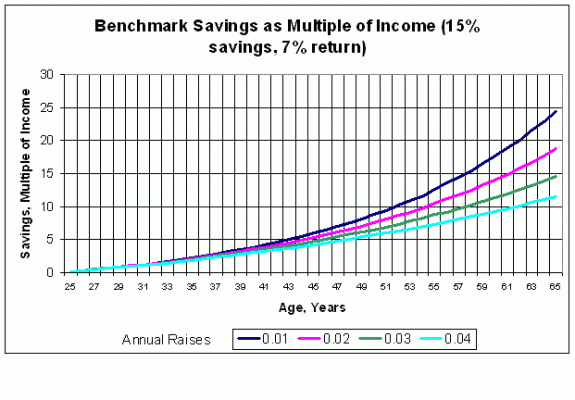
I couldn't resist. Here is another graph.
Its the same as the last graph, except I added lines to show the effect of getting bigger or smaller raises.
The top line is someone who is not very ambitious, or just unlucky or whatever - he only gets 1% per year raises. Remember that we were saying that's his real raise after inflation. So his actual raise might be 3.5%, but with 2.5% inflation.
His savings grow to a greater multiple of his income because his income doesn't grow very much.
Compare against our High Flyers, who get much better raises. They have a "harder" time reaching their magic number. To get back on track, they would need to increase the percentage of income that they save every year. Fortunately, they are getting big raises, so they have the money to do it.
One thing not shown on the graph is that the person getting 4% raises ends up filthy rich, where the 1%er can retire "comfortably". Also, the 4%er ends up making 5 times his starting salary after adjusting for inflation.
What would the annual raises have to be for someone if they worked their way up from the bottom today - Top executive pay is something like 100 times entry-level pay! Well, it turns out that you'd have to get 12% real (after inflation) raises for 40 years. That would be pretty impressive performance!
Attachments
I'm on a roll!
Last graph, I promise.
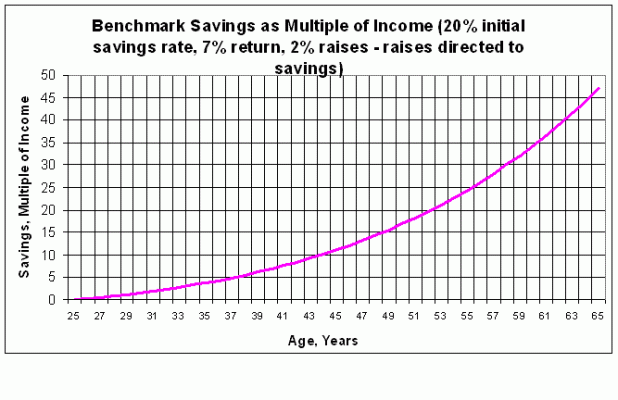
This graph shows what happens if you save your raises. I figured someone might try this to FIRE, so I bumped up the initial savings % to 20%, and then the savings % is increased by the real amount of the raise each year. You get to 25x salary when you're 55. However, as we all know here, you don't need 25 times your salary, you need 25 times your expenses. You can't find that point on the graph, but looking at the numbers on my spreadsheet says you reach that point at age 47!
And furthermore, that's not saving the whole raise! You're just saving the real portion. If you followed that approach, your standard of living would creep up slightly over the years. What if you controlled that, and saved more of your raises? You could retire even earlier. But now we are getting way outside of the usefullness of this simple benchmark, so you FIRE people are on your own.
Attachments
MasterBlaster
Thinks s/he gets paid by the post
- Joined
- Jun 23, 2005
- Messages
- 4,391
Well, that's a pretty interesting conclusion.
If you save 20 percent of your income and the increases over inflation in any raise that you get, Then you could retire in 22 years.
Work for 22 years and save hard and invest in assets that can grow (like equities). I think that fits many people on this forum.
something that you may want to consider is to make your plots with a log scale on the vertical axis. That way it is easier to see that the money is growing the whole time. Not just towards the end.
In those 22 years, if you raised a family, paid off student loans, bought used cars every few years, purchased a house, lived a normal lifestyle, stayed out of debt as much as possible, and weren't downsized or laid off too many times, I suggest the average North American worker and their families would be much happier if they lived one day at a time, did the best they could,and aimed for a more realistic 30 or 35 years.MasterBlaster said:Well, that's a pretty interesting conclusion.
If you save 20 percent of your income and the increases over inflation in any raise that you get, Then you could retire in 22 years.
Work for 22 years and save hard and invest in assets that can grow (like equities). I think that fits many people on this forum.
something that you may want to consider is to make your plots with a log scale on the vertical axis. That way it is easier to see that the money is growing the whole time. Not just towards the end.
MasterBlaster
Thinks s/he gets paid by the post
- Joined
- Jun 23, 2005
- Messages
- 4,391
Zipper said:In those 22 years, if you raised a family, paid off student loans, bought used cars every few years, purchased a house, lived a normal lifestyle, stayed out of debt as much as possible, and weren't downsized or laid off too many times, I suggest the average North American worker and their families would be much happier if they lived one day at a time, did the best they could,and aimed for a more realistic 30 or 35 years.
I hear rationalizations often as to why other people can't save. As has been discussed on this forum many times, it takes quite a bit of effort and some sacrifices to retire early.
slepyhed laid out a plausible and do-able action plan for retiring early. That's what this forum is all about.
kcowan
Give me a museum and I'll fill it. (Picasso) Give me a forum ...
In my case, a divorce and the 2000 market reversal extended the date, but without the original plan I would still be working...MasterBlaster said:slepyhed laid out a plausible and do-able action plan for retiring early. That's what this forum is all about.
SLC Tortfeasor
Recycles dryer sheets
- Joined
- Jun 17, 2005
- Messages
- 233
This is interesting. According to the graphs, I'm basically right on track with where I should be on the baseline. This is actually a little disconcerting, because I feel like I'm doing way, way more for retirement than any of my peers. And early retirement is so . . . far . . . away . . . .
kcowan
Give me a museum and I'll fill it. (Picasso) Give me a forum ...
But nobody else is working to plan (well few others), so don't be discouraged. When you RE most of your peers will be incredulous.SLC Tortfeasor said:According to the graphs, I'm basically right on track with where I should be on the baseline...
Meadbh
Give me a museum and I'll fill it. (Picasso) Give me a forum ...
- Joined
- Jul 22, 2006
- Messages
- 11,401
slepyhed said:This graph shows what happens if you save your raises.
That's what I'm doing. And, as Nords said, when you are FI, it does take some of the pressure off. You feel you can walk out at any time!!!
Similar threads
- Replies
- 15
- Views
- 7K
- Replies
- 38
- Views
- 39K
- Replies
- 75
- Views
- 13K


