A couple of stock charts

dex

Give me a museum and I'll fill it. (Picasso) Give me a forum ...
Joined
Oct 28, 2003
Messages
5,105
A couple of charts.
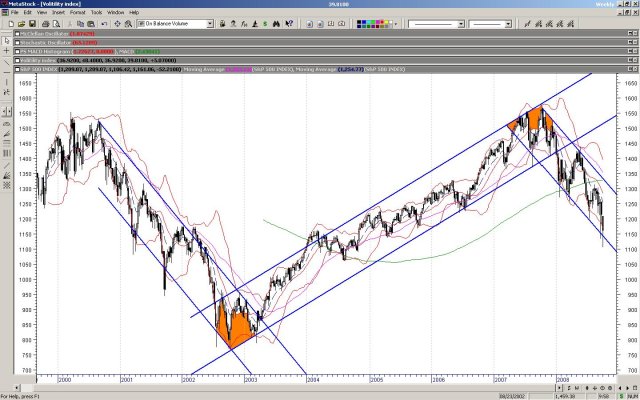
The s&p is primarily large stocks - the generals - it is in a downward channel.
See earlier time periods for what the change in trend looks like.

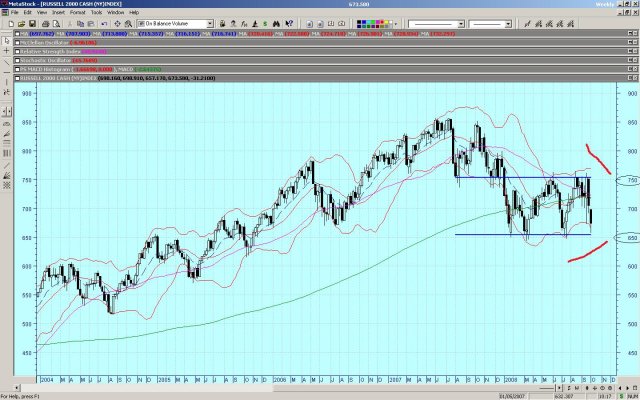
The RUT is small stocks - the troops - it is in a trading range. Breaking below 650 bad - above 750 good.
 

Attachments

  • snp.jpg
    snp.jpg
    214.5 KB · Views: 20
  • small.jpg
    small.jpg
    249.1 KB · Views: 19
Interesting I would not expect it to hold but if it did good for stock market!
 
rut closed at 638
 
Afraid to Trade.com Blog » The Three Hard Rules of Elliott Wave Theory

never learned Elliot Wave but here is something interesting. if the 2002-2007 bull was Wave 1 then the current retrace is very close to a 61.8 retracement that Wave 2 is supposed to be and we are about to start a new bull

I looked into Elliot wave - sounds good in theory - not in reality - alternative counts, where to begin to count, etc.

We might be in an oversold area now but not ready for a protracted upturn. New fears are coming into the market that have been pushed aside recently:
-effect of credit crunch - fear of slowdown
-fear of consumers not spending during the holidays
-effect of credit crunch on world markets
- politicians and news media hyping the negative.
This and other things will need to flow through the markets.

On the positive side
- November - election over
- Bail out money begins to flow into the market

This is a good time to buy - if you have the stomach.
If we go sideways from here - that would be great.
 
the theory is that you get the waves on short term charts and long term charts. means the daily action you should see the waves and if you look at charts spanning decades you should see it as well.

i've seen where you can make out the waves on charts over say a 10 year period, but anything over that we'll probably need another 1000 years of evidence or if anyone wants to research stock prices going back to when the NYSE was a bunch of people under a tree

technical analysis is right up there with efficient market hypothesis
 
Back
Top Bottom