Bond Yield Curve Flattening ???

It does, because sequence of returns risk is very real and you might not otherwise seriously consider it until it's too late.

There are a couple of issues/items to consider that should give you pause:

1. If a market downturn should happen, will you need to be drawing on the invested funds? When you draw on the invested funds during a downturn, you are locking in losses at that time - those (permanent) losses will not be made back if/when the market recovers. As you draw down during a market down turn, a fixed withdrawal amount will translate into a higher percentage of portfolio value.

2. What happens most recently in the market is going to have the greatest effect on your portfolio value, as it is applied to all prior contributions and gains. This is the basis of sequence of returns risk and why folks should move to a more conservative allocation as they near/reach retirement. You want that lifetime of contributions and gains to be able to carry you through retirement. Putting lots of it at risk is not justified for most folks.

3. In general, I find talk is cheap. Many folks easily say "Oh when the crash comes, I'll just stay the course, keep investing, and do just fine longer term - it's always worked out". Ask anyone near retirement who was too heavily invested in 2008 how that plan worked out. Honestly ask yourself where your threshold for pain is. Suppose you just retired, have $1M with a 50/50 allocation. The equity portion declines by 50% and the bonds stay flat. Now you're at $750k. Things aren't so rosy any longer. That's 50/50 - many swinging a big stick laugh at 50/50 and even 75/25...again, until it's too late. You'll see many folks very confident in their posts, freely handing out investment advice, what to invest in, laughing at folks who are conservative, using high equity allocation because they are doing so well with it ... today. That's what happens at market highs when things are going well. Avoid getting swept up in the euphoria.

Investment objective and risk tolerance - address those honestly and you'll be fine.

+1

Retired in 2013, DW still working, was terrified of what you describe above. I was ultra conservative and missed a big (further) runnup due to Fed intervention. I could not have anticipated the level that the Fed was willing to go to prop up the market. My conservative stance cost me in additional returns but it was the cost of ‘insuring’ against a huge drop right at retirement. Today I am no worse off (and a bit better) than I was when I retired. No big windfall since 2013 like the market, but no huge drop either. I am more comfortable now easing back in and will take advantage of the repricing that seems to be taking place. Getting closer to age eligibility for SS makes a big difference as well.
 
I do not think there will be a flat out stock market retreat this time. But heck what do I know?

I think it will get nickeled and dimed down with 100 - 300 point declines over time, rather than one or two whopping 1000-5000 point drops quickly. Unless of course there is a life event that triggers something.

The net net will be the same, an overall decline in the market or a small recession. One of those things that if one talks about something enough, it will eventually happen.
 
Last edited:
..... Ask anyone near retirement who was too heavily invested in 2008 how that plan worked out. Honestly ask yourself where your threshold for pain is. ....

That's me... ~60/40 or perhaps even more equities in 2008 and planning to retire at 55 in 2010. It was scary... by AA was literally screaming at me to rebalance but I didn't have the courage but I did stay the course... just held pat and did not sell. While we will never know what I would have done if I had been retired at that time, I suspect that I would have done the same thing... just held pat. Only real move was to OMY, but that was as much due to some things going on in our personal life as it was to improve our finances.

I'm coming around to think that a good strategy for dealing with sequence of turns risk might be to start out with a relatively conservative AA and simply rebalance equities only where they exceed target and just otherwise stand pat... that would naturally nudge you to redeem/live on bonds during downturns until stocks recover.

For example, start with $100 starting value at 60/40 and 3.5% WR... a 35% decline in equities and 5% rise in bond values... at end of year your portfolio is $81 and AA before withdrawals would be 48/52.... after 3.5 withdrawal your portfolio is 77.5....39 stocks and 38.5 bonds of ~50/50.

OTOH, if you start with $100 at 50/50 and the same assumptions, you end the year at 40/60 after withdrawals.
 
FWIW I thought that 10 year compared to 2 year was the conventional measure of curve flatness?

There was a Fed paper discussing the correlation of recessions and the 10yr, 3mo yield curve. Also this use of the yield curve is one of the components in the Fed’s Leading Index.
 
I thought it was going to be the end of the World the day the 10 year hit 3% for my Mreits. That didn't happen. What did happen was those stocks were already going down well in anticipation of rates rising. Once it hit 3% it was very much muted. It was already priced in.


What will the 10 year and 2 year do? I have no idea. Too many unknowns right now. But the 10 year has come down a little since not only reaching 3% , but advancing a bit past it.
 
There was a Fed paper discussing the correlation of recessions and the 10yr, 3mo yield curve. Also this use of the yield curve is one of the components in the Fed’s Leading Index.

That sounds interesting. Do you have any links?
 
I thought it was going to be the end of the World the day the 10 year hit 3% for my Mreits. That didn't happen. What did happen was those stocks were already going down well in anticipation of rates rising. Once it hit 3% it was very much muted. It was already priced in.


What will the 10 year and 2 year do? I have no idea. Too many unknowns right now. But the 10 year has come down a little since not only reaching 3% , but advancing a bit past it.

Some of the bond talking heads out there have noted something like 3.22% or 3.26% as the critical level to cross for the 10 year. We’ll see. It’s been having difficulty getting there.
 
That sounds interesting. Do you have any links?

Here is the Fed paper: https://www.newyorkfed.org/research/current_issues/ci12-5.html


And here is the description of the Leading Index (it mentions "state" because there are separate ones for the states but the one I use is for the entire US):
The leading index for each state predicts the six-month growth rate of the state's coincident index. In addition to the coincident index, the models include other variables that lead the economy: state-level housing permits (1 to 4 units), state initial unemployment insurance claims, delivery times from the Institute for Supply Management (ISM) manufacturing survey, and the interest rate spread between the 10-year Treasury bond and the 3-month Treasury bill.
 
... Suppose you just retired, have $1M with a 50/50 allocation. The equity portion declines by 50% and the bonds stay flat. Now you're at $750k. Things aren't so rosy any longer. ...
With respect, this would be faulty thinking.

Consider thunderstorms. They come along from time to time and we know that. This afternoon you're home and a particularly strong one comes along; thunder, lightning, rain & hail. You're not enjoying this and the dog is scared. You're really not scared, though, because you have enough food in the house that you won't have to go out even if the storm lasts through the dinner hour. You've also bought or built a good house, so you are not concerned about the storm causing any significant long-term damage. And, importantly, you know that the storm will pass. (Too bad the dog doesn't. :) )

Your theoretical 50% drop in equities is the investment equivalent of a thunderstorm. It isn't fun, but it really isn't a big deal either. Since WWII all of the investment storms have ended within 3-5 years of the first hit. Also, importantly, six of the best 10 market days in the last 20 years occurred within two weeks of the 10 worst days .

So ...

Case 1/Somewhat Conservative Investor: He/she simply settles in, spending from the safe fixed-income tranche, and waits for the 3-5 years he/she expects it to take for the market to recover. All during that recovery period, too, the market trend is (historically) upward so even if our conservative investor needs or wants to sell some equities after a few years, the hit will not be too bad.

Case 2/Strategic Investor: He/she sees that stocks are on sale and begins buying, fully understanding that they might go down more before they go up. He/she may not fully rebalance because that fixed income tranche is comforting and he/she doesn't want it to get too low. But when the storm ends, this investor will be a very happy with his/her portfolio.

Case 3/Foolish Investor: Foolish investor really doesn't see roses, doesn't understand the market and bails. There are a lot of these. JP Morgan data says that the average individual investor, over long periods of time, does not keep up with inflation. This is due to panicking, confusing speculation with investing, and to being overly conservative with investment choices.

At age 70 we are probably Case 1. We are 75/25 and a 50% drop would be a seven figure drop for us. We have been through many thunderstorms before, though, beginning in 1987. We'll be sleeping well.
 
Last edited:
Your theoretical 50% drop in equities is the investment equivalent of a thunderstorm. It isn't fun, but it really isn't a big deal either.

...
At age 70 we are probably Case 1. We are 75/25 and a 50% drop would be a seven figure drop for us. We have been through many thunderstorms before, though, beginning in 1987. We'll be sleeping well.


That's a great position to be in, congrats!

However, I would contend that the size of your portfolio plays a significant role in your risk tolerance - similar for others, or should play a significant role. Most folks are not sitting on multi-million dollar portfolios that could easily weather a 50% drop in equity value. Entering retirement with $1M is a milestone for many, and a drop to $750k as in my example would be a very significant big deal to those cases.
 
Entering retirement with $1M is a milestone for many, and a drop to $750k as in my example would be a very significant big deal to those cases.

I agree, for some even a 25% drop would mean the difference between being able to "Blow That Doe" on a really discretionary item or not.
 
That's a great position to be in, congrats!

However, I would contend that the size of your portfolio plays a significant role in your risk tolerance - similar for others, or should play a significant role. Most folks are not sitting on multi-million dollar portfolios that could easily weather a 50% drop in equity value. Entering retirement with $1M is a milestone for many, and a drop to $750k as in my example would be a very significant big deal to those cases.

We are closer to 2mm - still under the average on this forum with a 55/45 AA.
However our plans are to use a 3% WR of current portfolio (Clyatt 95% rule) for the near future and thus a 50% drop should cause us a net 25% portfolio drop and would effectively increase our WR to 4%.

That is the concept we will use vs. starting our retirement with a below 40% allocation.
 
That's a great position to be in, congrats!
Thanks. We have been very lucky in life.

However, I would contend that the size of your portfolio plays a significant role in your risk tolerance - similar for others, or should play a significant role. Most folks are not sitting on multi-million dollar portfolios that could easily weather a 50% drop in equity value.
Yes, but we had the same tolerance in 1987 when we were not dealing with big numbers. We have had some serious gut twinges along the way to where we are now. Nifty Fifty, tech bubble, mortgage derivatives crash, etc. but we have never once sold into a down market.

Entering retirement with $1M is a milestone for many, and a drop to $750k as in my example would be a very significant big deal to those cases.
I agree totally. The point of my post is that it really should not be a big deal, any more than a passing thunderstorm is. Easy to say, hard to do.
 
Yes, but we had the same tolerance in 1987 when we were not dealing with big numbers. We have had some serious gut twinges along the way to where we are now. Nifty Fifty, tech bubble, mortgage derivatives crash, etc. but we have never once sold into a down market.


But in 1987 you were ~40 and still had many years until retirement, with your peak earning years ahead of you.

I was specifically pointing to the case where retirement was within sight, as in the post I first replied to, and the argument for dialing down risk (for most) as it approaches.
 
... 3. In general, I find talk is cheap. Many folks easily say "Oh when the crash comes, I'll just stay the course, keep investing, and do just fine longer term - it's always worked out". Ask anyone near retirement who was too heavily invested in 2008 how that plan worked out. ...

Well there's a set up for you. Sure, if they were "too heavily invested", they almost by definition, were worried. How about those who had an aggressive AA, yet felt that was not "too heavy" (or they would have had a lower AA!)? My plan worked out well, and I was ~ 75/25, and did do some re-balancing, and that paid off handsomely.

So you are wrong to say "anyone/everybody". I also do not "laugh at folks who are conservative", but I do try to inform them of the risks, if they seem to not be aware of them. Some here are very conservative, but appear to understand what that means (big stash, low WR), so fine. Nothing "funny" about that.

... Sigh. I vowed never to time the market, but it does seem like this pre-retirement phase deserves a more conservative allocation.
It does, because sequence of returns risk is very real and you might not otherwise seriously consider it until it's too late.

There are a couple of issues/items to consider that should give you pause:

OK, it has come up from time to time that we can avoid sequence of returns risk by being conservative in the first few years. That always seemed like an almost 'free lunch' to me, an illusion, but never thought too much about it, as it just wasn't something I was going to do. But this got me thinking, and now I'm pretty convinced it is just an illusion, not backed up by data.

Let's consider a 35 year retirement time frame, and Person A wants to go conservative for the first 5 years to avoid "sequence of returns" risk. The first thing we need to consider is that they may face large cap gains taxes to go from a typical accumulation-phase AA to conservative. OK, maybe it's all in an IRA (not likely, but possible).

We can further assume (not entirely valid, but OK for rough illustration purposes), that their conservative portfolio keeps up with inflation. So after 5 years, they go back to a more aggressive portfolio, fine. But then we need to do a FIRECalc run for a 30 year period, and there you go - you get hit with the "sequence of returns" risk in those first 5 years. It's not like the market can separate your first 5 years from everyone else's first 5 years! It just doesn't work that way. And it cost you 5 years of what is on average, growth.

I don't think you can escape sequence of returns so easily. Is there a flaw in my thinking? Does this deserve a separate thread?

-ERD50
 
Last edited:
Flattening Yield Curve Is Good For Stocks

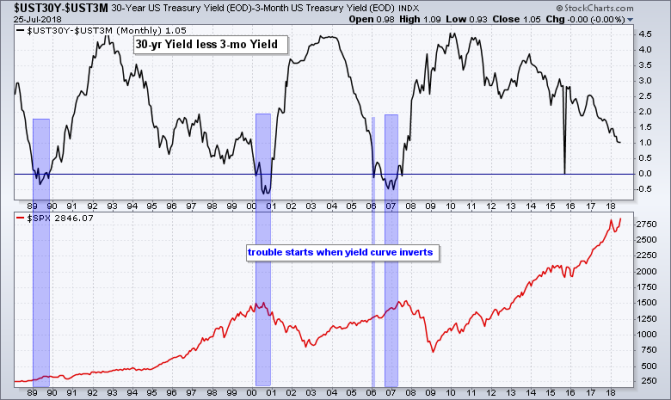
Here is a chart of the yield curve (30 year - 3 month) in the top panel and the S&P 500 in the lower panel. When the yield curve line drops below 0, it has inverted. I have noted the periods where the curve inverted in blue. As you will notice the yield curve is flattening, but has not inverted.

Most of the news media keeps mentioning that the flattening yield curve is signaling a recession and thus an immanent stock market correction. This is just historically false. Actually when the yield curve has historically flattened it has been positive for stocks. Also, if you look at the last time that the yield curve inverted (July 2006), it took the stock market over a year to final peak out.

So in summary, yes a flattening yield curve is something to watch and it has been a very good indicator of past recessions and stock market peaks. However, stocks typically peak months after the yield curve inverts. So with that in mind, the flattening yield curve is not signaling anything ominous "yet".
 

Attachments

  • yield curve.png
    yield curve.png
    46.2 KB · Views: 59
Thanks Mr. Technician, that is an informative post. And yes, as you point out, the yield curve is flattening, not inverted, which is a different animal.

Personally, I don’t believe that an inverted yield curve is inevitable. The long end seems a bit disconnected from the short-end at the moment and global interest rates seem to have a big impact on US long rates, pulling them down. There is also the still accelerating QE unwind which should be pushing things up a bit. It is interesting to watch this unfold.

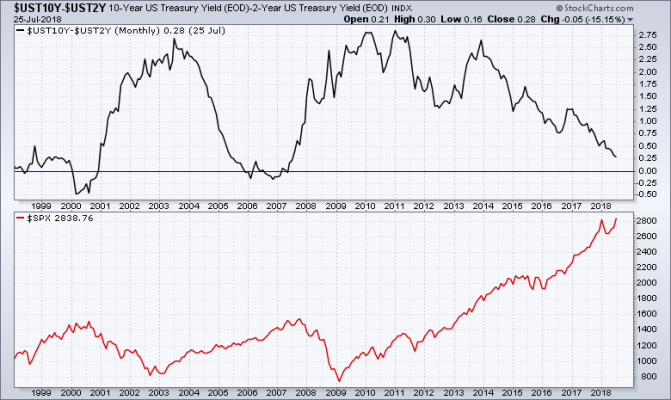
Your chart is the 30 year versus 3 month which has a much larger spread than the 10 year versus 2 year.
 
OK, it has come up from time to time that we can avoid sequence of returns risk by being conservative in the first few years. That always seemed like an almost 'free lunch' to me, an illusion, but never thought too much about it, as it just wasn't something I was going to do. But this got me thinking, and now I'm pretty convinced it is just an illusion, not backed up by data.

Let's consider a 35 year retirement time frame, and Person A wants to go conservative for the first 5 years to avoid "sequence of returns" risk. The first thing we need to consider is that they may face large cap gains taxes to go from a typical accumulation-phase AA to conservative. OK, maybe it's all in an IRA (not likely, but possible).

We can further assume (not entirely valid, but OK for rough illustration purposes), that their conservative portfolio keeps up with inflation. So after 5 years, they go back to a more aggressive portfolio, fine. But then we need to do a FIRECalc run for a 30 year period, and there you go - you get hit with the "sequence of returns" risk in those first 5 years. It's not like the market can separate your first 5 years from everyone else's first 5 years! It just doesn't work that way. And it cost you 5 years of what is on average, growth.

I don't think you can escape sequence of returns so easily. Is there a flaw in my thinking? Does this deserve a separate thread?

-ERD50


Wade pfau on managing SORR: https://www.forbes.com/sites/wadep...aging-sequence-of-returns-risk-in-retirement/

Kitces on rising equity to reduce SORR: https://www.kitces.com/blog/should...is-a-rising-equity-glidepath-actually-better/

Kitces and Pfau together on rising equity glide path and SORR: https://poseidon01.ssrn.com/delive...7028018092072026109010025073005083116&EXT=pdf
 
Last edited:
I don’t understand economics, and trying to read these charts gives me a headache. But I’ve decided that I’m moving toward retiring in a year (meaning, cutting back my hours even further), at 66, so I moved everything from VG Target 2025 to Target 2020. I’m also going to move another account from an index ETF to laddered CDs or bonds. Getting ready. Articles about the yield curve prodded me to get moving on this, as did turning 65!
 
Thanks Mr. Technician, that is an informative post. And yes, as you point out, the yield curve is flattening, not inverted, which is a different animal.

Personally, I don’t believe that an inverted yield curve is inevitable. The long end seems a bit disconnected from the short-end at the moment and global interest rates seem to have a big impact on US long rates, pulling them down. There is also the still accelerating QE unwind which should be pushing things up a bit. It is interesting to watch this unfold.

Your chart is the 30 year versus 3 month which has a much larger spread than the 10 year versus 2 year.

Here is the 10 - 2.
 

Attachments

  • 10 - 2.png
    10 - 2.png
    55 KB · Views: 189
Back
Top Bottom