I've avoided market timing but...

Seems like if you’re not terribly greedy, you could get back in at 10% down and boost your returns that way. The problem is you may call a peak, get it wrong and miss out on 10% while your money sits on the sidelines. There’s no way to consistently get it right.

In 2008 you caught a bunch of falling knives using this method.

Ask me how I know :facepalm: - rebalancing triggers actually, but essentially the same.

Thus folks waiting to get back in usually wait for signs of stabilization and the some appreciation before getting back in.

But then there is always the fake out dead cat bounce......

Calling bottoms is really, really, really hard.
 
I’m officially going to the dark side......

Starting Jan, I’m shifting to a sliding stocks/fixed income AA ratio based on CAPE10. It won’t vary much, sliding between 50/50 and 60/40 with “neutral” at 55/45. The variation will also occur slowly because CAPE10 is a 10 year average.

Been working on this new plan all year. It was motivated by having an additional chunk to roll into my retirement portfolio from some legacy company stock that I finally sold. Decided I was ready to be a bit more conservative with CAPE10 so high. My target AA at the beginning of this year was 53/47, so it’s not a huge change now. But when stocks eventually drop it will also let me invest a bit more aggressively - even if it takes years to get there.

So you can call me a dirty old lady now.

In case anyone wonders the CAPE10 range I’m using is for 50/50 CAPE10 >= 25, 60/40 for CAPE10 <= 18. It’s not a large swing. This range was picked based on the last 25 years. Based on this history, most of the time the portfolio will be at 50/50 or slightly above, with rare forays into somewhat higher equity allocations after a large market change.

I’m not comfortable dropping below 50% equities, but also not comfortable going above 60% equities so this range matches my comfort zone. I’m 58 and have been retired for over 18 years. DH is 62. No pensions or SS, completely dependent on investments fo income.

I think this will help me stay invested with the bigger pile, maybe with slightly reduced anxiety. It also helps me deal with the current market valuation which really bugs me.

Oh no!! Our Audreyh1 is turning into a DMT. :D

I hope it works out for you. I'm staying with my tried and true 45:55 AA, because it got me through 2008-2009. It seems to be something I can stick with even when everything is in free fall. You will probably make more money than I will, though.
 
Oh no!! Our Audreyh1 is turning into a DMT. :D

I hope it works out for you. I'm staying with my tried and true 45:55 AA, because it got me through 2008-2009. It seems to be something I can stick with even when everything is in free fall. You will probably make more money than I will, though.
It might improve my long-term results a small amount. The variation is slight. AA drift will be mostly gradual, based on history.

I had to face the fact that I have a really hard time ignoring equity market valuations which makes it really hard for me to buy more stocks at current levels.

Funnily, I have no problem letting equity investments ride that were invested years ago. It's the new funds that forced the issue.
 
Follow-up...

I have a transfer order going through today to move approximately 23% in total of my combined IRA/401k (currently 100% stocks) to Vanguard Intermediate-Term Bond Index Fund (IRA) and Vanguard Total Bond Market Index Fund (401k), with no plans to re-balance or transfer back unless/until the market seems to regress to where it historically 'should be' (define as I will at some future date - or rather when my analysis implies that the market has gone below that long term line that math suggests it has straddled ... which is the fun part to figure out at some later time :rolleyes: )

If the market continues to climb, the other 77% is invested rather aggressively on a LONG term view of let it sit and grow. In anticipation of a pullback I may see how this works out... and I may just leave the allocation for the long run. Will reassess as I go.
 
^I don't think today is a bad day to buy bond funds nor a bad day to sell equity funds. Good luck!
 
Years ago, while a w@rking stiff, my 401k strategy was to purchase the worst preforming fund/market segment whenever I got my quarterly statement, and I got paid once a month. I kept the same strategy whenever I started getting paid every two weeks, it took the bumps out of purchases.

But I don't want to sound like Dave Ramsey, but I concur that we invest because we hope/pray/desire/expect the market to be higher in the future than it is today. And I agree with the Senator, the important thing is to buy.
 
Years ago, while a w@rking stiff, my 401k strategy was to purchase the worst preforming fund/market segment whenever I got my quarterly statement, and I got paid once a month. I kept the same strategy whenever I started getting paid every two weeks, it took the bumps out of purchases.

Sounds a bit like the Dogs of the Dow strategy.
 
I retired in 1999, so have already been through two big ones. And that CAPE10 is flashing red again just like it did before those events. Changes in accounting rules since 2001 and dropping 2008 out of the average has only a very modest reducing effect. It’s still red. [...]

I've always objected to the amount of importance given to CAPE10: an evenly weighted 10 year average seems like an extremely naive way to model market potential.

For one - why 10 years? Seems like someone just liked a nice round number. For another, why is the year 10 years ago just as important as last year is when it comes to future performance? An exponentially-weighted moving average would make a lot more sense, in my opinion.

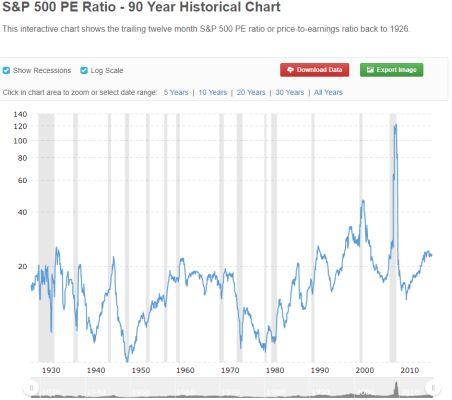
I've attached a chart of the S&P 500 PE.

The big spike you see during the recession is in Feb/Mar. 2009 and should still be a part of the CAPE10 average.

In 2019, this will magically fall off the cliff, reducing CAPE10 by as much as 10 points (how much depends at which arbitrary date one's CAPE10 computation is choosing to calculate its value each year).

There's no doubt that PEs are near historical highs, but I don't feel CAPE10 adds much insight as to whether the market's over-extended or not.
 

Attachments

  • S&P 500 PE.PNG
    S&P 500 PE.PNG
    79.8 KB · Views: 19
The big spike you see during the recession is in Feb/Mar. 2009 and should still be a part of the CAPE10 average.

In 2019, this will magically fall off the cliff, reducing CAPE10 by as much as 10 points (how much depends at which arbitrary date one's CAPE10 computation is choosing to calculate its value each year).

There's no doubt that PEs are near historical highs, but I don't feel CAPE10 adds much insight as to whether the market's over-extended or not.

Yes CAPE has flaws, but the roll-out of the recession will take about 3 points off CAPE, not 10. Think about it, you are replacing one year out of a 10 year average - approximately 10% of the data. 10% of the current ~32 CAPE is ~3 points.

You can also see it here https://dqydj.com/shiller-pe-cape-ratio-calculator/ by trying CAPE10, CAPE9, and then CAPE8 where it magically drops by 3 points.

Your logic is incorrect - you're not losing an average year - you're losing a specific year with a specific value.

The spike is at about 120 - the low the following year is around 13.

This means that about 100 extra points disappear when the spike disappears. These points are being spread over 10 years of average, so the net effect is: 100/10 = 10.

If you're losing only 3 points, that implies that the arbitrary date point you picked for the annual average probably falls on a point that is around 50, instead of around 120.

Math (I'll do this over 5 years to simplify things a bit).

5 year CAPE of 30:
110 + 10+ 10 + 10 + 10 = 150
150/5 = 30

If next year's PE is 10 again, CAPE goes from 30 to 10:
10 + 10 + 10 + 10 + 10 = 50
50/5 = 10

20 point drop, just because one year passed. By your logic this change should have been 6 points.
 
I've always objected to the amount of importance given to CAPE10: an evenly weighted 10 year average seems like an extremely naive way to model market potential.

For one - why 10 years? Seems like someone just liked a nice round number. For another, why is the year 10 years ago just as important as last year is when it comes to future performance? An exponentially-weighted moving average would make a lot more sense, in my opinion.

I've attached a chart of the S&P 500 PE.

The big spike you see during the recession is in Feb/Mar. 2009 and should still be a part of the CAPE10 average.

In 2019, this will magically fall off the cliff, reducing CAPE10 by as much as 10 points (how much depends at which arbitrary date one's CAPE10 computation is choosing to calculate its value each year).

There's no doubt that PEs are near historical highs, but I don't feel CAPE10 adds much insight as to whether the market's over-extended or not.

I’ve done analysis with CAPE7 and CAPE8. Removing 2009 doesn’t help that much - not enough to bring down the very high valuations. A recent spike may disappear, but it’s still above 2007 levels. I don’t see this falling off the cliff effect you describe.

Are you saying there is something wrong with the https://dqydj.com/shiller-pe-cape-ratio-calculator/ calculator?
 
Last edited:
I'm simply trying to maintain my 40/60 Equity ratio with an eye on both the cape10 and yield curve. This is where the dividend only strategy gets tricky. If I sell the dividend yielders I give up income. If I sell the TSM holdings I risk giving up growth. However, now that growth stocks are sliding back a little the situation may correct itself. As usual no reason to do anything ;)
 
Yes CAPE has flaws, but the roll-out of the recession will take about 3 points off CAPE, not 10. Think about it, you are replacing one year out of a 10 year average - approximately 10% of the data. 10% of the current ~32 CAPE is ~3 points.

You can also see it here https://dqydj.com/shiller-pe-cape-ratio-calculator/ by trying CAPE10, CAPE9, and then CAPE8 where it magically drops by 3 points.

Yep.
 
Hey, here's a bit of sunshine, perverse as it is coming from a gloomy guy like me.

The 12-month trailing P/E is high at almost 25. However, the earnings are increasing such that if the S&P stays where it is, the P/E for 2018 will drop to 19. If the tax cut promised by the new tax law realizes, the 2018 P/E will drop further to something like 18 or lower.

Of course, the market may rise further and push the P/E back to the stratosphere, before coming back down that is.
 
Last edited:
I’ve done analysis with CAPE7 and CAPE8. Removing 2009 doesn’t help that much - not enough to bring down the very high valuations. A recent spike may disappear, but it’s still above 2007 levels. I don’t see this falling off the cliff effect you describe.

Are you saying there is something wrong with the https://dqydj.com/shiller-pe-cape-ratio-calculator/ calculator?

There are two factors at play here:
1. I was under a misconception of how CAPE10 is calculated - Mea culpa. I thought it was a simple moving average of PE - it is actually the sum of inflation-adjusted earnings over the last 10 years divided by current price. This changes the strength of the effect I described.
2. The site uses monthly numbers, so can get more granularity - since not all of 2009 had dismal earnings.

Even with the new definition, I still feel that CAPE10 is far too arbitrary a measure to be of much value in predicting performance. Visual analysis of a PE chart provides similar value.

Here's a decent discussion of some of the considerations by Larry Swedroe: Swedroe: CAPE 10 Ratio In Need Of Context | ETF.com
Title: Swedroe: CAPE 10 Ratio In Need Of Context
excerpted quote:
However, the market looks less overvalued if we change the horizon. Why would we consider a different horizon? First, as mentioned earlier, there is nothing magical about using 10 years to calculate the earnings average. Graham and Dodd even suggested using a five- or seven-year period. More importantly, in 2008, the earnings of the S&P 500 temporarily collapsed as a result of the financial crisis.
 
Announcement: I sold down to a 50/50 position from 60/40 last Friday. This is the lowest equity level since the dark days of 2009.

Now don't all go out and sell tomorrow based on my guru status here. ;)

I keep a short financial diary on one tab of my portfolio spreadsheet There are only about a half dozen entries per year. Here is what I wrote before selling the equity:
SP500 up 23% last 12 months. PE10 rank is at about 85%. We are 16% above inflation corrected start retirement portfolio. We have very good totals now. No need to take too much equity risk, VPW looks good in worst 1966 scenario. 50% in equities still gives us good gains should market move higher. I worry a bit about a 1962 type decline. I will be more relaxed and possibly make better financial decisions.
I have no illusions that I lightened up at an optimal time.
 
Last edited:
Even with the new definition, I still feel that CAPE10 is far too arbitrary a measure to be of much value in predicting performance. Visual analysis of a PE chart provides similar value.

Here's a decent discussion of some of the considerations by Larry Swedroe: Swedroe: CAPE 10 Ratio In Need Of Context | ETF.com
Title: Swedroe: CAPE 10 Ratio In Need Of Context
excerpted quote:
Yes, I'm familiar with Swedroe's work on the CAPE10 and changes in accounting rules since 2001. Still, when taken into account, the affect is small compared to current levels. And I am doing comparisons from mid-1990s to current most of which follows under the new accounting rules, not using the long term average or median as some kind of bible of where markets "should" be in terms of returning to some historical mean.

I wanted a measure of evaluation averaged over a long time and the well researched and documented CAPE10 is good enough for my purposes.

CAPE10 does in fact predict market returns over longer time frames.
Nonetheless, the reality is that while Shiller CAPE has little predictive value in the short term, its correlation to market returns is far stronger over longer time periods; Shiller CAPE shows its strongest correlation to nominal returns over an 8-year time horizon, and is actually most predictive of real returns over an *18* year time horizon… supporting Benjamin Graham’s old adage that the markets may be a voting machine in the short run, but they are ultimately a weighing machine in the long run as valuation eventually takes hold.
https://www.kitces.com/blog/shiller...t-valuable-for-long-term-retirement-planning/
 
Last edited:
Announcement: I sold down to a 50/50 position from 60/40 last Friday. This is the lowest equity level since the dark days of 2009.

Now don't all go out and sell tomorrow based on my guru status here. ;)

I keep a short financial diary on one tab of my portfolio spreadsheet There are only about a half dozen entries per year. Here is what I wrote before selling the equity:
I have no illusions that I lightened up at an optimal time.

I love the “financial diary” idea and may steal that... unless, of course it has been copy righted:cool:
It would be interesting to look back 5, 10 years and see how things played out.

What’s interesting in all of the chatter on this subject is it appears many have some degree of a MT bug in them that makes them want to tinker some. The results seem to be more about appealing to their emotions and “sleep factor” than really moving the needle from a results standpoint. As someone said, statistically or historically, if moving from 60/40 to 50/50 only protects your down side by roughly 5%, have you really accomplished much as opposed to staying the course? I am no different as my inner financial guru tells me equities are too high, but then again, what do I know.
 
In spite of the high CAPE and Bitcoin craziness, I am sticking to my written plan.

"Reallocate annually to the target asset allocation".
 
Announcement: I sold down to a 50/50 position from 60/40 last Friday. This is the lowest equity level since the dark days of 2009.

Now don't all go out and sell tomorrow based on my guru status here. ;)

I keep a short financial diary on one tab of my portfolio spreadsheet There are only about a half dozen entries per year. Here is what I wrote before selling the equity:
I have no illusions that I lightened up at an optimal time.

I understand. We are considering moving from 70/30 to 65/35 or even 60/40. We are ahead of where we thought we would be and we are retired. May be time to act like W. Bernstein and take some money off the table. (The pre-meltdown Bernstein) :)
 
I love the “financial diary” idea and may steal that... unless, of course it has been copy righted:cool:
It would be interesting to look back 5, 10 years and see how things played out.

For me the key is to keep such a dairy short and very focused. Otherwise there is too much verbiage to look back on. Been doing this since 2005.

What’s interesting in all of the chatter on this subject is it appears many have some degree of a MT bug in them that makes them want to tinker some. The results seem to be more about appealing to their emotions and “sleep factor” than really moving the needle from a results standpoint. As someone said, statistically or historically, if moving from 60/40 to 50/50 only protects your down side by roughly 5%, have you really accomplished much as opposed to staying the course? I am no different as my inner financial guru tells me equities are too high, but then again, what do I know.
I kind of agree with you on this. When I set the AA at 60/40 some years back, I set up a few conditions that would make me rethink the AA. They are:
(1) Equities hitting new highs and/or PE10 rank for last 30 years > 85%
(2) Our inflation adjusted portfolio is >110% of the start retirement portfolio
(3) 5 yr TIPS > 2.2%, i.e. pays to have money in bonds

Well the first 2 are satisfied but the last is not (5yr real rate is 0.4%).

Note, I am not going to worry about the label market timer. Just a pragmatic investor trying to enjoy life.
 
I love the “financial diary” idea and may steal that... unless, of course it has been copy righted:cool:
It would be interesting to look back 5, 10 years and see how things played out.

What’s interesting in all of the chatter on this subject is it appears many have some degree of a MT bug in them that makes them want to tinker some. The results seem to be more about appealing to their emotions and “sleep factor” than really moving the needle from a results standpoint. As someone said, statistically or historically, if moving from 60/40 to 50/50 only protects your down side by roughly 5%, have you really accomplished much as opposed to staying the course? I am no different as my inner financial guru tells me equities are too high, but then again, what do I know.

That 5% represents over a year of withdrawals, so it is in fact significant.
 
I went from 80/20 to 75/25. That is as far as I'll let myself go. And actually since I am getting older and closer to FI, it probably makes sense just to stay there.


The US total market is up 27% since this post was made. I guess I should've stayed at 80/20.
 
The US total market is up 27% since this post was made. I guess I should've stayed at 80/20.

Hindsight is 20/20. As for myself I am comfortable with 50/50. That is a result I can live with. Others may feel differently and readjust according to their whimsical nature.
 
One has to be prepared with common sense. Economy humming, everyone's happy with market, positive energy flowing...Best Laid Plans. As TromboneAl has suggested in his many ideas for books, a virus hits (Coronavirus). International travel drastically slowed. Markets get scared. We've been here before. We are holding 60/35/5 for at least 5 years. I don't over/underestimate tomorrow. It is what it is.
 
Back
Top Bottom