2Black
Dryer sheet wannabe
- Joined
- Nov 15, 2017
- Messages
- 21
Hi guys,
Short: would like your feedback on below portfolio strategy.
I finally got around reading ‘a random walk down wall street’ and I like it a lot.
The one thing I don’t like is the performance of the buy & hold strategy chapter 15 etc.
So I played around with a portfolio created on this site https://www.portfoliovisualizer.com/ somebody here mentioned a while back (again thanks for that).
My objective was:
-stick close to the buy & hold strategy used in the book
-low maintenance
-use only a few etf’s (keep it simple)
-stick close to the x% shares + y% bonds strategy
-minimum trading (less costs/less time)
-improve the big drawdown’s like 2008
-used ETF’s that go back in data before 2008 to include the big dip.
So I started with:
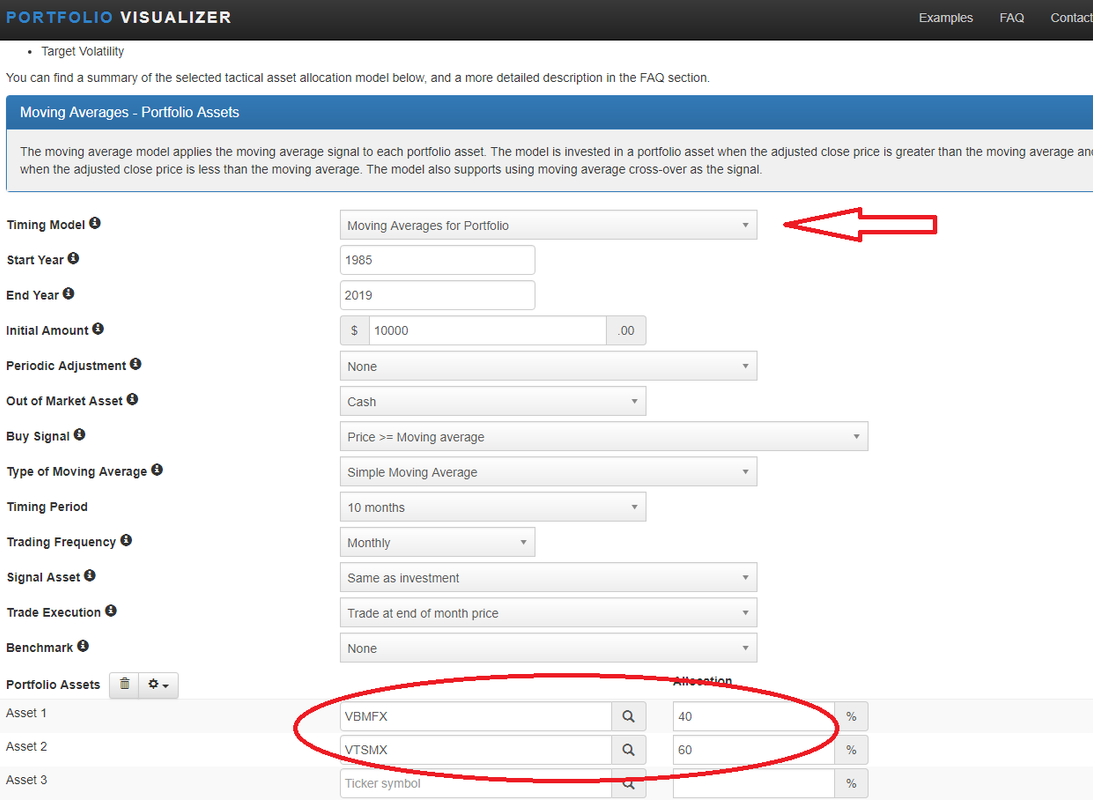
30% AGG (bonds)
60% SPY (sp500)
10% GLD (gold)
The buy and hold of these 3 give me a nice performance.
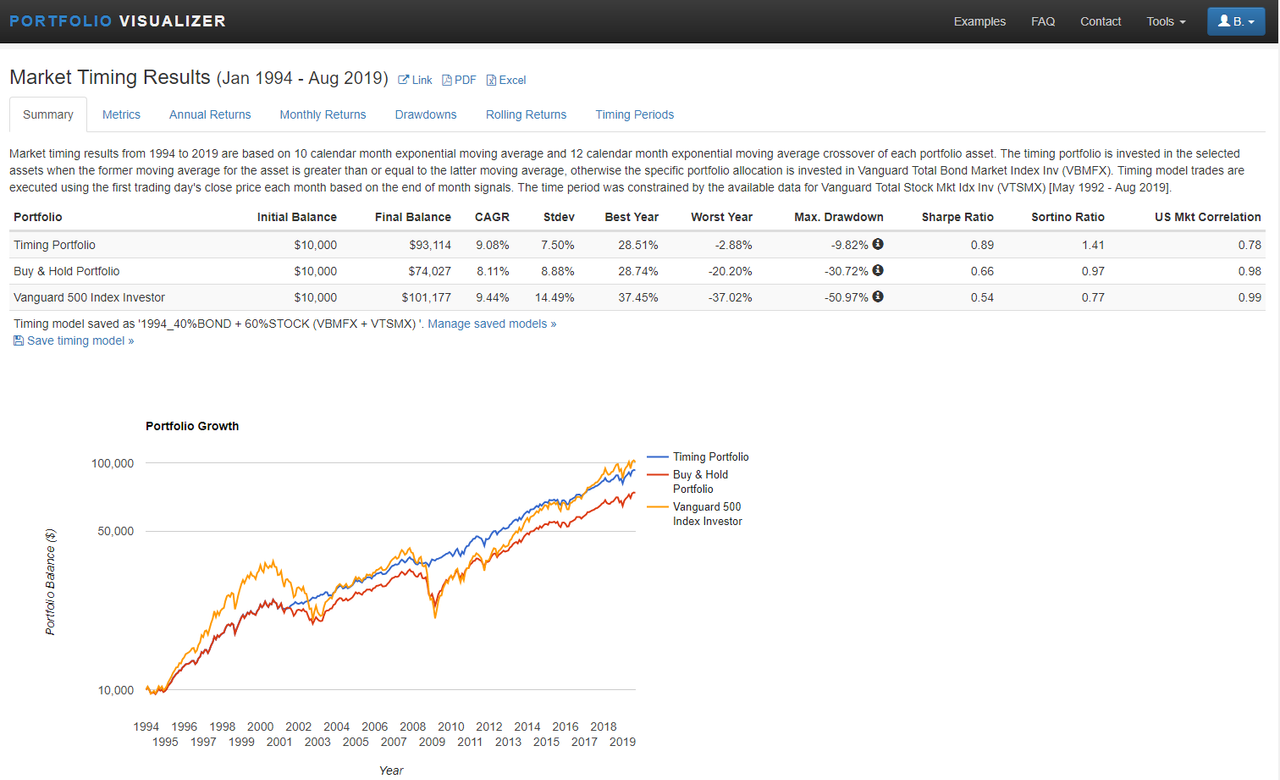
The big drawdown in 2008 is improved from -50.9% to -29.5%, overall CAGR changes from 8.02% to 7.36%
I can live with the reduced CAGR but -29% is still quite a bit (too much for my taste)
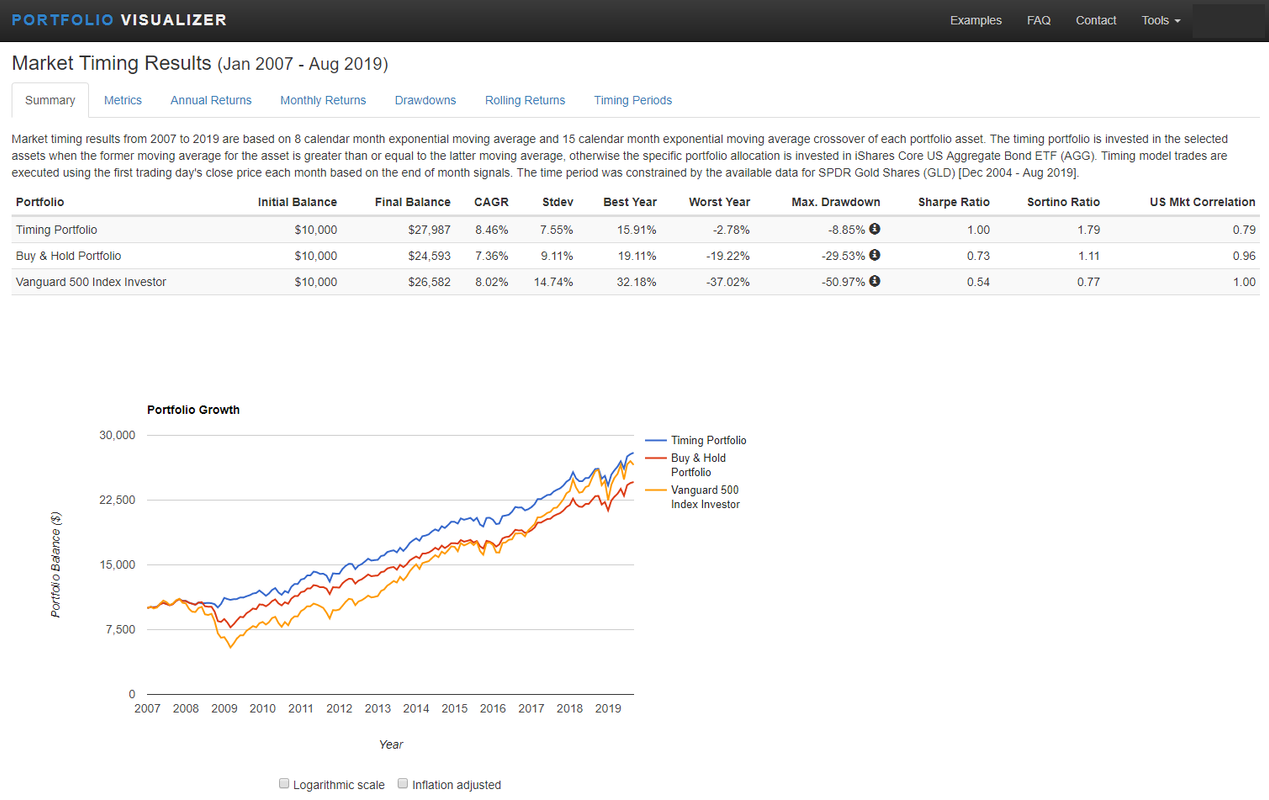
When I add a simple moving average timing model it improves further to max drawdown -8.85% and CAGR=8.46%
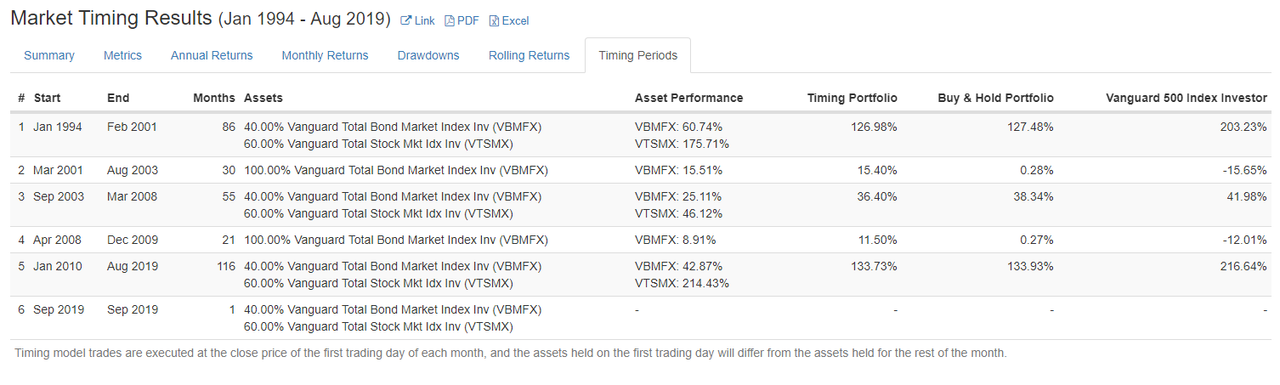
The total trades from jan 2007 till now is 9 and if you change from monthly trade to bi-monthly it hardly effects performance and brings down the trades to 7.
Changing the parameters for the moving average by a few months also doesn’t change much on the performance which I see as a good thing meaning its more robust and not over fitted.
I know you can’t see the future and back testing only works so much, but still…
Any arguments why I should not use this?
All feedback welcome,
Short: would like your feedback on below portfolio strategy.
I finally got around reading ‘a random walk down wall street’ and I like it a lot.
The one thing I don’t like is the performance of the buy & hold strategy chapter 15 etc.
So I played around with a portfolio created on this site https://www.portfoliovisualizer.com/ somebody here mentioned a while back (again thanks for that).
My objective was:
-stick close to the buy & hold strategy used in the book
-low maintenance
-use only a few etf’s (keep it simple)
-stick close to the x% shares + y% bonds strategy
-minimum trading (less costs/less time)
-improve the big drawdown’s like 2008
-used ETF’s that go back in data before 2008 to include the big dip.
So I started with:
30% AGG (bonds)
60% SPY (sp500)
10% GLD (gold)
The buy and hold of these 3 give me a nice performance.
The big drawdown in 2008 is improved from -50.9% to -29.5%, overall CAGR changes from 8.02% to 7.36%
I can live with the reduced CAGR but -29% is still quite a bit (too much for my taste)
When I add a simple moving average timing model it improves further to max drawdown -8.85% and CAGR=8.46%
The total trades from jan 2007 till now is 9 and if you change from monthly trade to bi-monthly it hardly effects performance and brings down the trades to 7.
Changing the parameters for the moving average by a few months also doesn’t change much on the performance which I see as a good thing meaning its more robust and not over fitted.
I know you can’t see the future and back testing only works so much, but still…
Any arguments why I should not use this?
All feedback welcome,