payout diagram

JohnEyles

Full time employment: Posting here.
Joined
Sep 11, 2006
Messages
608
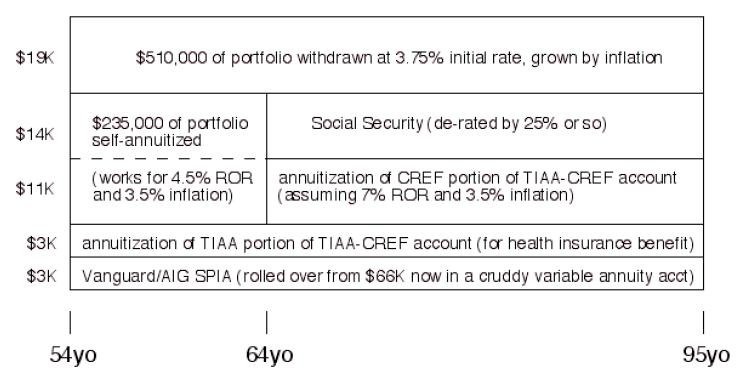
I have been thinking about draw-down of portoflios a lot, and how that fits in
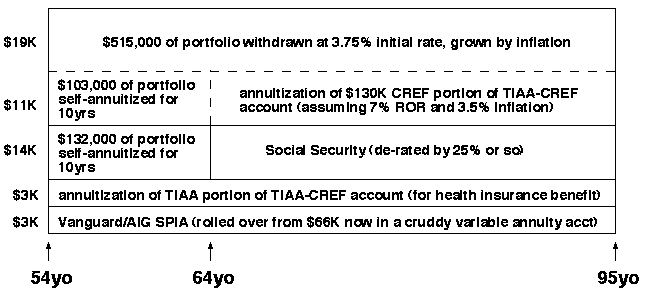
with Social Security, pension annuites, and such; so I created the attached
drawing (plan_payout.pdf). I find it a helpful way to keep things straight in
my head, and I hadn't seen it before in my short time at this stuff.
I imagine the various blocks could be further subdivided into taxable and
tax-advantaged portions in order to better see how the tax-dance will work
out. Maybe it can be put into a spreadsheet so that blocks self-compute
as you change their sizes ...
 

Attachments

  • plan_payout.pdf
    18.4 KB · Views: 119
Very nice, JE! I like the idea of visualizing the chunks; easier for me than just a list of digits.
 
I agree it's a good way to visualize the plan. I have something similar with current cash being self annuitized for pre-SS and health insurance before Medicare.

Your taxable/taxed account breakout would give you a picture of your effective tax rates and whether it would be practical/possilbe to convert from an IRA to a Roth. That's my plan prior to SS.
 
ladelfina said:
Very nice, JE! I like the idea of visualizing the chunks; easier for me than just a list of digits.

Deja Vu.............. "Visualizing the chunks" reminds me of too much beer
and pizza in my misspent youth. :)
JG
 
Trying to find your PDF, do not know how to bring up.

Please advise.
 
Here is John's plan in jpg format:
 

Attachments

  • TEST.JPG
    TEST.JPG
    41.6 KB · Views: 66
  • TEST.JPG_thumb
    11.7 KB · Views: 0
I must be dense this morning. I am having a difficult time interpreting your chart. Could you explain it please?

Grumpy
 
JE,

Nice job. How are you planning to handle the RMDs at age 70?
 
grumpy said:
I must be dense this morning. I am having a difficult time interpreting your chart. Could you explain it please? Grumpy

Ditto
 
there must have been a dense fog this morning.
 
hogwild said:
Nice job. How are you planning to handle the RMDs at age 70?

Ain't got that far yet. But I think the basic idea is to live mainly off IRA money in
between turning 59 (or even before under Rule 72) and starting SS and CREF payouts.
Thus limiting "other income" once SS starts and reducing taxability of SS.

As far as how the chart works ... well, horizontal axis is time, and vertical axis
is annual income. So, for example, since the "annuitization of TIAA" block runs
all the way across horizontally, it means I'll start that now (i.e. 54yo) and continue
it indefinitely, and it'll provide $3K/yr of income (today's dollars, grown to match
inflation of course). The block labeled "$235,000 of portfolio self-annuitized" means
I'll start taking $25K annually from that, and time the annuitization for 10yrs,
so that chunks runs out at age 64; at that point I'll begin SS and the CREF payout,
and shown by the blocks that run from 64yo til 95yo.

Here is the latest version (I can't seem to get it to include the expanded drawing, so
you'll have to click on the plan_payout.png link at the bottom), which I think shows
the utility of this graph approach a little more. The dotted lines in the uppermost
block indicate the fact that the decision about taking my CREF as an annuity can
be deferred until 64yo. If I choose to annuitize, then the dotted lines are drawn in
and I have a $515K portfolio withdrawn at 3.75%, a $103K self-annuity to makeup
CREF until I'm 64yo, and the CREF annuity from 64yo onwards; if I choose not to
annuitize (and take the CREF as a lump-sum), then the dotted lines go away and
I view it as a single $750K portfolio withdrawn at 4%. (This makes it seem that
the CREF annuitization is the way to go, since it requires only a 3.75% WR from the
bulk of my porfolio and the portion that's not guaranteed to last as long as I do).
Either way, regardless of which way I view that block (as a single one, or broken
up by drawing in the dotted lines), for now I withdraw $30K/yr from that chunk
of money.
 

Attachments

  • plan_payout.png
    plan_payout.png
    4 KB · Views: 55
  • plan_payout.png_thumb
    11 KB · Views: 0
I'll be damned if I see what all of the confusion is about, it took me about 30 seconds to figure out how to read the link. Excellent idea John. I have concocted a simular way to visualize my future income cash flow on Excel, in fact I like your idea a little better than mine.

Sometime (most times?) simple is the best way. "The simpler the explanation, the more likley it is to be correct" - Occam's Razor
 
You have done in one little diagram what it took me 2 full exel pages to do - good on you JE! I'm going to steal the concept for my explanation of things to DH!
 
Reactions to this diagram remind me of the user testing I did for the first multimedia documentaiton I created. Tester comments ranged from, "You should hand out popcorn with that!" to "Couldn't you just give me a bulleted list?" :LOL:
 
Back
Top Bottom