Midpack
Give me a museum and I'll fill it. (Picasso) Give me a forum ...
Branching from the earlier thread http://www.early-retirement.org/for...rates-asset-allocation-to-equities-65054.html, more plug-n-chug using FIRECALC, this time starting with $1M and a 3% WR for 30 years.
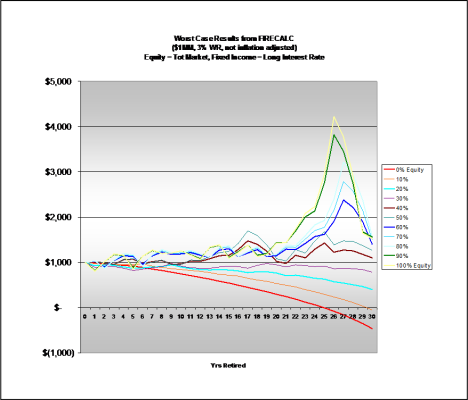
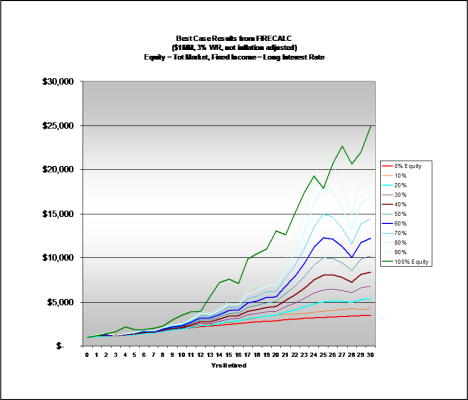
The charts below** are as if you plotted only the best and worst outcomes for the 11 AA's from FIRECALC, without all the other results(that would be a little busy with 1,221 lines). 30 years uses 111 30 year periods.
Note also the 0% and 10% equity allocations both fail before 30 years, and 20-30% both "deplete principal" in a sense. Even at lower WR's, some equity exposure is required to avoid depleting principal (shown on the earlier thread).
The table below ($'000s) is simply a summary of the results after 30 years for both charts.
% Equity|
Initial Value|WR|
Worst Case|
Worst Start Year|
Best Case|
Best Start Year
0%|
$1,000|3%|
$ (464)|
1941|
$ 3,452|
1980
10%|
$1,000|3%|
$ (49)|
1940|
$ 4,260|
1980
20%|
$1,000|3%|
$ 406|
1937|
$ 5,379|
1975
30%|
$1,000|3%|
$ 784|
1937|
$ 6,785|
1975
40%|
$1,000|3%|
$ 1,102|
912|$ 8
,386|
1975
50%|
$1,000|3%|
$ 1,267|
1912|
$ 10,193|
1975
60%|
$1,000|3%|
$ 1,400|
1902|
$ 12,211|
1975
70%|
$1,000|3%|
$ 1,495|
1902|
$ 14,443|
1975
80%|
$1,000|3%|
$ 1,559|
1902|
$ 16,890|
1975
90%|
$1,000|3%|
$ 1,563|
1903|
$ 19,546|
1975
100%|
$1,000|3%|
$ 1,521|
1903|
$ 24,892|
1942
The charts below** are as if you plotted only the best and worst outcomes for the 11 AA's from FIRECALC, without all the other results(that would be a little busy with 1,221 lines). 30 years uses 111 30 year periods.
**However, these numbers are not inflation adjusted, you'll have to apply the inflation factors to get results to match the basic FIRECALC output (but then they will match).
Looking at the worst case chart and the corresponding volatility (risk) with increasing % equity exposure might be instructive for determining what you can live with and still 'sleep at night.' To my eye the difference between 40-50% equity and 100% equity is not worth the considerably higher volatility, the difference in returns after 30 years is not that great. IOW, that's one big WHEE!!! YMMV
Note also the 0% and 10% equity allocations both fail before 30 years, and 20-30% both "deplete principal" in a sense. Even at lower WR's, some equity exposure is required to avoid depleting principal (shown on the earlier thread).
The table below ($'000s) is simply a summary of the results after 30 years for both charts.
Attachments
Last edited:

