You are using an out of date browser. It may not display this or other websites correctly.
You should upgrade or use an alternative browser.
You should upgrade or use an alternative browser.
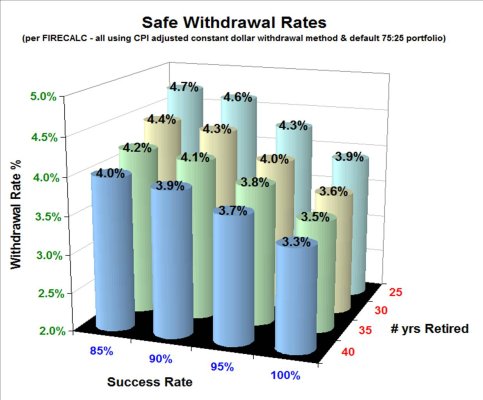
Chart of Withdrawal Rate - Success Rate - Yrs Retired
- Thread starter Midpack
- Start date
shasta
Recycles dryer sheets
yeah bravo.
RetireAge50
Thinks s/he gets paid by the post
- Joined
- Aug 6, 2013
- Messages
- 1,660
Really cool, easy to read chart!
Firecalc/Other Calculator W/drawal Rates
If I'm hijacking this thread, please just ignore me or something...
Great chart, but my issue with Firecalc is it doesn't factor in for taxes though it does factor in fees. I-Orp and FRIP factor taxes but not fees. Given these limitations, does anyone else find it difficult to reconcile results produced by these 3 calculators? For me, I-Orp is the most generous, followed by FRIP, and then by Firecalc if I try to "guestimate" taxes (particularly since I'm delaying SS til 70 and looking at minimizing RMD's plus SS taxes). I would find this chart more meaningful if Firecalc included taxes like I-Orp does.
Finally, and forgive me, but isn't any xExpenses figure relatively meaningless unless both taxes and fees are both considered?
OP
OP
Midpack
Give me a museum and I'll fill it. (Picasso) Give me a forum ...
FIRECALC and i-ORP are free remember, and no calculator can provide an "xExpenses figure" that's anything but a ballpark number at best. I find them both useful planning tools for different reasons, and future taxes are an unknown like most input/variables, especially for long term projections. I'd rather factor in taxes for myself, so I know what the assumptions are, and range of sensitivity.If I'm hijacking this thread, please just ignore me or something...
Great chart, but my issue with Firecalc is it doesn't factor in for taxes though it does factor in fees. I-Orp and FRIP factor taxes but not fees. Given these limitations, does anyone else find it difficult to reconcile results produced by these 3 calculators? For me, I-Orp is the most generous, followed by FRIP, and then by Firecalc if I try to "guestimate" taxes (particularly since I'm delaying SS til 70 and looking at minimizing RMD's plus SS taxes). I would find this chart more meaningful if Firecalc included taxes like I-Orp does.
Finally, and forgive me, but isn't any xExpenses figure relatively meaningless unless both taxes and fees are both considered?
Last edited:
REWahoo
Give me a museum and I'll fill it. (Picasso) Give
If you find a calculator that accurately accounts for future taxes you might suggest whoever designed it also include accurate future market returns. That's a calculator I would gladly pay to use.Great chart, but my issue with Firecalc is it doesn't factor in for taxes...
")
Last edited:
Brilliant responses. Thank you. This is why I love this site. Retiring 5 years earlier than originally planned (ground zero date: 12/14), overcame my OMY syndrome, read plenty of recommended awesome books (e.g.., 4 pillars of investing), created and committed to an investment plan--and done a whole lot more to create my ER plan--all because of what I've learned from this site. Thank you. I mean really.
I've used them all and do like the FRIP for the reason that it does appear to do a fairly good job of accounting for taxes when you look at details of future withdrawals. Yeah, I assume they're using current tax rates but that's about as good as anything. We have over 1/2 our stuff in tIRA's and FRIP does a good picture of how the required withdrawals hit at 70-1/2. Motivating me to sit down with tax adviser to move some to Roths.
ERD50
Give me a museum and I'll fill it. (Picasso) Give me a forum ...
Yes, very nice chart. I think this does a great job of demonstrating that it really isn't that huge of a sacrifice to take a conservative stance regarding success and longevity. Some people feel it is going to extremes to plan for above 95% success, and/or for more than a 30 year retirement, but the extra assurance doesn't really 'cost' all that much.
100% for 40 years only required a 20% adjustment (in spending or portfolio size) compared to 95% and 30 years. And it seems to level off beyond there. Of course everyone must decide for themselves, but it's not like everything has to double for a marginal gain.
I guess the way I look at it is, it isn't a limitation of FIRECalc, it simply means you must consider it in your expenses. FIRECalc still does what it does just fine. But that part is up to you.
I have not played with those other calculators much (IIRC they use Monte Carlo, which does not appeal to me), but I don't know how they could guess at future taxes. I think I'd rather just take my own WAG.
-ERD50
100% for 40 years only required a 20% adjustment (in spending or portfolio size) compared to 95% and 30 years. And it seems to level off beyond there. Of course everyone must decide for themselves, but it's not like everything has to double for a marginal gain.
...
Great chart, but my issue with Firecalc is it doesn't factor in for taxes though it does factor in fees. ...
Finally, and forgive me, but isn't any xExpenses figure relatively meaningless unless both taxes and fees are both considered?
I guess the way I look at it is, it isn't a limitation of FIRECalc, it simply means you must consider it in your expenses. FIRECalc still does what it does just fine. But that part is up to you.
I have not played with those other calculators much (IIRC they use Monte Carlo, which does not appeal to me), but I don't know how they could guess at future taxes. I think I'd rather just take my own WAG.
-ERD50
golfnut
Full time employment: Posting here.
Great chart. Love to see with a 50/50 stock and bond mix.
daylatedollarshort
Give me a museum and I'll fill it. (Picasso) Give me a forum ...
- Joined
- Feb 19, 2013
- Messages
- 9,358
That is a great chart, Midpack. Thanks.
OP
OP
Midpack
Give me a museum and I'll fill it. (Picasso) Give me a forum ...
It wouldn't change much at all, but you can easily test that for yourself by just entering a couple cases and comparing them...Great chart. Love to see with a 50/50 stock and bond mix.
Last edited:
Thanks for that chart.
I do these manually / in table form to assess these sensitivities.
My takeaway is that reducing spending 20% to go from 95 to 100% isn't necessary.
If a bad trajectory occurs then I'll adjust future spending.
You can run firecalc beginning in a future year - at lower spending and with fewer years to fund. That way you can assess how effective such cuts will be out in time.
On question: is a 3-4% increase in the firecalc success rate statistically significant or is it in the noise?
REWahoo
Give me a museum and I'll fill it. (Picasso) Give
Noise in my opinion.
ERD50
Give me a museum and I'll fill it. (Picasso) Give me a forum ...
Thanks for that chart. ....
One question: is a 3-4% increase in the firecalc success rate statistically significant or is it in the noise?
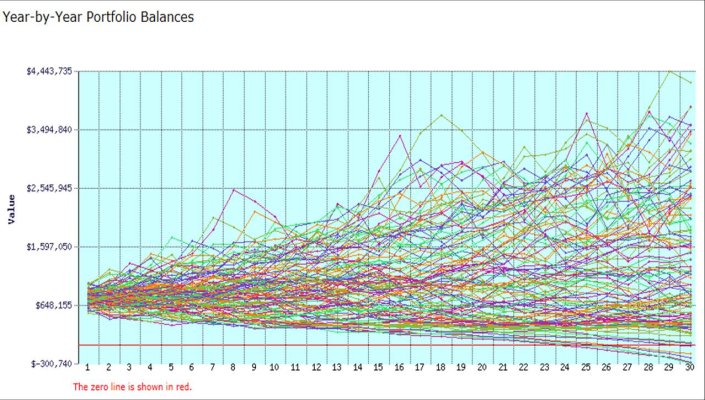
If I were in one of the six scenarios that failed, I would consider it significant. You can't pay the bills with 'noise'. Plus the next dozen or so that came within a cat's whisker of failing. That would not be too comfortable.
Many feel that the future could well be worse than the past. You might need some extra margin.
-ERD50
OP
OP
Midpack
Give me a museum and I'll fill it. (Picasso) Give me a forum ...
Some people can (temporarily) lose perspective with retirement calculators/planning, but if you look at the underlying result from FIRECALC, is there any doubt? Calculators planners can suggest where to aim the shotgun, but you still get a shotgun blast scatter no matter where you aim...On question: is a 3-4% increase in the firecalc success rate statistically significant or is it in the noise?
Noise in my opinion.
Attachments
Last edited:
I think "only" might be loosely applied here.Some people feel it is going to extremes to plan for above 95% success, and/or for more than a 30 year retirement, but the extra assurance doesn't really 'cost' all that much.
100% for 40 years only required a 20% adjustment (in spending or portfolio size) compared to 95% and 30 years.
Depending on market performance and stash rate that extra 20% of portfolio size might be five more years of work, no small chunk of someone's life.
walkinwood
Thinks s/he gets paid by the post
+1.Thanks for that chart.
I do these manually / in table form to assess these sensitivities.
My takeaway is that reducing spending 20% to go from 95 to 100% isn't necessary.
If a bad trajectory occurs then I'll adjust future spending.
You can run firecalc beginning in a future year - at lower spending and with fewer years to fund. That way you can assess how effective such cuts will be out in time.
On question: is a 3-4% increase in the firecalc success rate statistically significant or is it in the noise?
Unless you plan to slavishly increase your annual spend CPI and have no buffer in your budget, a little flexibility can go a long way.
Nice chart.
Lsbcal
Give me a museum and I'll fill it. (Picasso) Give me a forum ...
Midpack, that is a nice chart. Is it done with Excel or something else?
That chart brings up another thought. I usually run my FIRECalc runs with just 20 years. But I put a floor on the allowed decline of about 50% of the starting portfolio so that is the "failure". The logic is that if I got down to that 50% level it would already be really scary to me and might require drastic action ... like moving into smaller digs. Also I'd be in my 80's after 20 years. That is a point we might easily see selling the big house. So at least in our case, 35 years is a possibility but the withdrawal rates and major actions might be out there in only 20 years. At 20 years markets and health issues might easily make all this planning quite different. I'm sure what I'm saying in this paragraph is well known to many reading here. Just thought I'd reiterate it.
That chart brings up another thought. I usually run my FIRECalc runs with just 20 years. But I put a floor on the allowed decline of about 50% of the starting portfolio so that is the "failure". The logic is that if I got down to that 50% level it would already be really scary to me and might require drastic action ... like moving into smaller digs. Also I'd be in my 80's after 20 years. That is a point we might easily see selling the big house. So at least in our case, 35 years is a possibility but the withdrawal rates and major actions might be out there in only 20 years. At 20 years markets and health issues might easily make all this planning quite different. I'm sure what I'm saying in this paragraph is well known to many reading here. Just thought I'd reiterate it.
I hope I'm not one of those people who "(temporarily) lose perspective with retirement calculators/planning"...although it wouldn't be the first time I've lost perspective...
What I've done to overcome FIRECALC's not including fees or taxes is use the off chart spending in the Other Income/Spending tab. For taxes, however, I could think of no way to guesstimate yearly taxes other than take the avg of all taxes FRIP estimates for the duration of my retirement. Don't like taking the avg of anything, but could think of no better way. Any suggestions?
BTW, rerunning these new numbers in FRIP, I-ORP, and FIRECALC results in FIRECALC and I-ORP roughly equal in results with FRIP much more conservative.
Some people can (temporarily) lose perspective with retirement calculators/planning, but if you look at the underlying result from FIRECALC, is there any doubt? Calculators planners can suggest where to aim the shotgun, but you still get a shotgun blast scatter no matter where you aim...
Yeah.. That was a bit of a rhetorical question.
Today I had my first meet with my Vanguard CFP.
I explained that neither the best or worse case would ever come to pass.
If the best case trajectory is in progress I'm probably buying some Ferrari's.
In a worse case scenario I'll be enjoying mac and cheese during my annual home vacations. LOL
Although I use all the online calculators that most here use, I put most of my faith in ESPlanner which does include the tax part of the equation; federal, state, medicare, etc. Cost me $199 for the plus version, but was money well spent as I don't believe I would have left cush Megacorp gig without its smooth consumption scenarios.
Over the past couple days I've taken the Total Spending figure from ESP and used Arizona Salary Paycheck Calculator | Payroll Calculator | Paycheck City to calculate an equivalent salary. It was enlightening to see how much tax I'm not paying.
Over the past couple days I've taken the Total Spending figure from ESP and used Arizona Salary Paycheck Calculator | Payroll Calculator | Paycheck City to calculate an equivalent salary. It was enlightening to see how much tax I'm not paying.
Two observations, only you can decide if they are related:BTW, rerunning these new numbers in FRIP, I-ORP, and FIRECALC results in FIRECALC and I-ORP roughly equal in results with FRIP much more conservative.
1) Compared to I-ORP and FIRECalc, the tool supplied by Fidelity Investments indicates you'd need to save/invest more money.
2) Fidelty Investments makes more money when people invest more money.
Taxes: Don't overthink it. No calculator in the world is going to be able to tell you what tax policies will be in 30 years. I'd use the current rate structure and policies, maybe add a few percent at the higher levels. If your portfolio takes off and puts your annual income into the very high tax brackets when you are 80, is it really a concern? You'll be happy to pay it, right?
Midpack,
Thanks for the groovy chart. I used to be able to make really great charts and graphs with Excel, then they "improved" it and got rid of the chart wizard. Too bad, as it worked really well. Down the Microsoft Memory Hole, along with File Manager.
Last edited: