The Magic Formula Experiment

Thanks Totoro and Huston55 for the clarifications.

My confusion was likely the result of one or more of these: Too little caffeine, ineffective multitasking, ineffective skimming or just plain getting older.
 
Intend to pick this thread up every so often in the coming years for myself and others to enjoy, so best to start afresh. I posted bits and pieces already around the forum earlier.

Thanks for posting about this. I love reading about these real time mini-experiments.

  • There is a huge spread in returns between individual companies within the list. I'll post a histogram later on.
  • Given that, 10 stocks is not nearly enough to diversify. The book mentions this, now I understand better why.

I have read this about small cap investing that the returns are made with a small number of homeruns but never looked at the data myself. Although your data set is small, you could run a simulation with your histogram (pretending it was the true distribution) and determine just how many stocks you need to diversify and get within +/- X percent of the population average.

First results after 9 months (Nov. 17 2014). Note that this is without dividends, but the general picture is the same (did some spot checks).

  • S&P 500 gained about 13%
  • The entire 50 company list gained about 13% too
  • The smallest 20 companies gained about 17%
  • My selection gained about 4% (oops)
I don't think S&P 500 is the right benchmark but in anycase I believe microcaps as a whole have not done well this year. So maybe your 4% is better than expected (although unclear if it is due to noise).


The average market cap of VTI is $40 billion or more than 100x large than what size companies he is buying. VB Vanguard Small Cap the average market cap is just under $3 billion or 10x as big as he is buying. The average position size of VB is over $5 million. The liquidity of companies stock is so small that isn't not worth the time and effort for almost any institutional money managers to deal with them.

Yeah Vanguard is not the place to go for microcap stocks. However there are other fund companies that run micro cap etf's/indexes etc. I have one whose holdings average 200M in size.

The drawback of these funds are usually higher expense ratios. However I would hope that they take advantage of the lack of liquidity (i.e. dfa' patient trading strategy) to improve returns which cannot be done by an individual investor. I'm not sure of the effect size here but perhaps this will offset a big chunk of the expense ratio.
 
Mine was a simpler experiment. About 25 yrs ago, I participated in a dividend reinvestment plan to buy company stocks, slowly and reinvest all dividends.
These were S&P 500 stocks, large cap. It was like throwing dart in the wall, with little fundamental analysis, but I tried to be diversified. Of the 18 stocks, only 1 lost money, One change it's name, & had spin offs, some grew slower than S&P index, three grew more than 10X the original invested. I invested 10K per stock, and at the end of the experiment when I retired, the portfolio was worth more than 650K. I sold part of the biggest gainers, while we are still in the bull market.
I don't know how I did compared to my other investments.
My only regret is that, if I only doubled the original amount, and let it run,
then, the current value is about 1.3 Million.
 
...
The drawback of these funds are usually higher expense ratios. However I would hope that they take advantage of the lack of liquidity (i.e. dfa' patient trading strategy) to improve returns which cannot be done by an individual investor. I'm not sure of the effect size here but perhaps this will offset a big chunk of the expense ratio.

Another drawback for funds that Goldblatt mentions is that fund managers have to answer to their investors on (at least) a quarterly basis. That puts pressure on them to "do something" (window dressing) that the true magic formula investor doesn't have; if you have bought into the idea, you'll be sticking with the methodology for three years, not making mid-course corrections.
 
Mine was a simpler experiment. About 25 yrs ago, I participated in a dividend reinvestment plan to buy company stocks, slowly and reinvest all dividends.
These were S&P 500 stocks, large cap. It was like throwing dart in the wall, with little fundamental analysis, but I tried to be diversified. Of the 18 stocks, only 1 lost money, One change it's name, & had spin offs, some grew slower than S&P index, three grew more than 10X the original invested. I invested 10K per stock, and at the end of the experiment when I retired, the portfolio was worth more than 650K. I sold part of the biggest gainers, while we are still in the bull market.
I don't know how I did compared to my other investments.
My only regret is that, if I only doubled the original amount, and let it run,
then, the current value is about 1.3 Million.

First, I'm a DRIP supporter. Have used the same approach in the past.

Second, not sure I'm interpreting your investment timeline correctly but, if you bought all 18 stocks ~25yrs ago, your investment value has increased a little less than 4-fold and your avg AR over that 25yrs is ~5.3%.

During the same 25yrs, the S&P grew from ~340 to 2040, a 6-fold increase with an avg AR of ~7.5%.
 
Another drawback for funds that Goldblatt mentions is that fund managers have to answer to their investors on (at least) a quarterly basis. That puts pressure on them to "do something" (window dressing) that the true magic formula investor doesn't have;

I try to get funds that are either indexes or have a mostly passive trading strategy (i.e. they don't try to pick winners/losers within the asset category) to avoid above mentioned problem. However, due to their small size of AUM, I have seen some funds distribute large capital gains (which might not be wanted) when a larger institutional investor decides to dump it.
 
Just to go on record.

On December 15th I bought the following 20 stocks in equal share. Largest market cap at buy time was around 300m, smallest 30 or so.

Now all I have to do is sit on my hands and watch the experiment unfold. Benchmark will be the S&P 500.


  • AFOP
  • MSB
  • PETS
  • VEC
  • SPOK
  • CCUR
  • ONE
  • TZOO
  • AWRE
  • ADMS
  • PTIE
  • GORO
  • WILN
  • PFMT
  • LBMH
  • MNDO
  • PDLI
  • RPXC
  • RGR
  • LQDT
 
Thought today I'd do a quick interim review, full analysis 15 dec. of this year.

Above stocks are roughly up about 7% vs. SPY 6%. Both in USD terms, and excluding dividends. Dividends are slightly higher on the stocks vs. SPY I think, but haven't checked in detail.

Supposed January effect didn't really materialize as far as I can tell.

The volatility pattern continues. Notable home run is ADMS (doubled), implosion-of-the-year-to-date award goes to PFMT ("Performant Financial Corp.", what's in a name ..). It halved.

Looking forward to judgement day coming December.
 
Just to go on record.

On December 15th I bought the following 20 stocks in equal share. Largest market cap at buy time was around 300m, smallest 30 or so.

Now all I have to do is sit on my hands and watch the experiment unfold. Benchmark will be the S&P 500.
Because of the market-cap range, why use S&P500 and not a small-cap index, fund, or ETF?

Year-to-7/16 performance
VOO (S&P500): 4.3%
VB (small-cap): 5.6%

What dates did you use for your SPY 6%? Morningstar has 4.25% Y-T-6/16.
 
Good point.

Numbers I used came from finance.yahoo.com. SPY today closed at 212.47, on 15 Dec 2014 it closed at 199.51 (when I bought the shares). That's 6.5%. So not year-to-date performance exactly. Morningstar has the same figures.

I used SPY as a quick proxy for my investment alternative if this fails, worldwide indexing (Vanguard VT - up 7.2%, had to check now :)).

Indeed better (to see where differences come from) to look at equivalent index class too. VB ended today at 123.08 NAV, was 112.57 on Dec. 15 2014 (+9.3%).

So a bit better than SPY, quite a bit worse than VB, about the same as VT.

Again without dividends (VB has a lower yield), disregarding transaction or management fees and a short time frame. Roughly same I'd guess, but certainly no outperformance magic as of yet.
 
Last edited:
Update after second year of magic formula. It is what I would call a not good result.

Sold out positions on 20th of january 2016, so kept the stocks a bit longer than a year, due to travel.

Summary result:
S&P 500 during that time: roughly -7%
Stocks listed below in aggregate: -28%

Both excluding dividends, but the difference is pretty striking.

Longer update to follow.
 

As you can see below, no big winners and plenty of big losers. Overall pretty bad. % difference is buy vs. sell value in USD.

  • AFOP ( -2%)
  • MSB (-81%)
  • PETS (+31%)
  • VEC (-40%)
  • SPOK ( -1%)
  • CCUR (-23%)
  • ONE (-20%)
  • TZOO (-44%)
  • AWRE (-37%)
  • ADMS (+57%)
  • PTIE (-9%)
  • GORO (-61%)
  • WILN (-67%)
  • PFMT (-72%)
  • LBMH (+19%)
  • MNDO (-32%)
  • PDLI (-64%)
  • RPXC (-38%)
  • RGR (-5%)
  • LQDT (-58%)
 
I guess you need to wait for that jackpot stock to bail out.
 
.. so what's next for the magic formula experiment?

I will continue to monitor the new selection I made using the same approach as last year, and see what happens with them. However I will no longer put my money in it given the failure to a) deliver on the promise so far and b) the individual stocks I selected myself have outperformed the market with a lower beta during the past five years.

Just to elaborate on the failure to deliver: the little book claims that if one selects from the small cap universe that in every single year it outperforms the S&P 500 and in addition there is no year it has negative returns. Given it has broken these two boundaries I am becoming more cautious. Aware obviously mr. Greenblatt claims you need to follow the approach for 3 to 5 years, which is why I'll still track the new selection.

So expect a new post in this thread somewhere in 2017 :cool:

WLDN
ESI
NRT
BSQR
CLCT
UNTD
VEC
NHTC
MCFT
BBSI
LIFZF
AGX
BPT
PDLI
CPLA
OUTR
IQNT
ENTA
RPXC
SCMP

[Edit] : selection was done on January 19th. 50 stocks selected from the screener, took the smallest (in market cap) 20 from that list. As you may have seen a few that were on the list last year are still there (e.g. VEC, PDLI, RPXC)
 
Last edited:
As others have posted, The S&P500 is the wrong index to compare to. You need a mid-cap or small cap index. Apples and oranges here. Midcap/Smallcap stocks tend to do very well early in the business cycle.

And more importantly, you need to track the results over 15 years or so to make any statistically relevant conclusions about your method. Short term trends (one way or the other) could just be luck (good or bad) rather than method.
 
.. so what's next for the magic formula experiment?

I will continue to monitor the new selection I made using the same approach as last year, and see what happens with them. However I will no longer put my money in it given the failure to a) deliver on the promise so far and b) the individual stocks I selected myself have outperformed the market with a lower beta during the past five years.

Just to elaborate on the failure to deliver: the little book claims that if one selects from the small cap universe that in every single year it outperforms the S&P 500 and in addition there is no year it has negative returns. Given it has broken these two boundaries I am becoming more cautious. Aware obviously mr. Greenblatt claims you need to follow the approach for 3 to 5 years, which is why I'll still track the new selection.

So expect a new post in this thread somewhere in 2017 :cool:

WLDN
ESI
NRT
BSQR
CLCT
UNTD
VEC
NHTC
MCFT
BBSI
LIFZF
AGX
BPT
PDLI
CPLA
OUTR
IQNT
ENTA
RPXC
SCMP

[Edit] : selection was done on January 19th. 50 stocks selected from the screener, took the smallest (in market cap) 20 from that list. As you may have seen a few that were on the list last year are still there (e.g. VEC, PDLI, RPXC)

I did a similar experiment with real money a couple years ago. Something that is CRITICAL to what Greenbladt says is that the strategy only worked over a 5 year+ horizon. In fact he emphasizes that the reason it works even though the data is out there and the strategy is simple is because the wild swings drive people out and the "obvious badness" of the company keeps people away.

I stopped after 2 years because it was too stressful :)... so I guess I'm in that category.

Another important part is to buy 4-5 stocks every quarter based on the changes in criteria.

What I did is go here: https://www.magicformulainvesting.com/
and then take the top 30 stocks with 50m market cap. That way I didn't have to run all the screens myself.

Didn't bother to track how it would have done over the last 3 years (Which would have been the 5 year window) as I discovered... psychologically I'm not that kind of investor.

Lots of luck!
 
As others have posted, The S&P500 is the wrong index to compare to. You need a mid-cap or small cap index. Apples and oranges here. Midcap/Smallcap stocks tend to do very well early in the business cycle.

Given that my baseline alternative is to invest in the S&P 500 it is the right benchmark for me. I am not trying to outperform the mid-cap or small cap index. Greenblatt also uses the S&P 500 as his yardstick. Why bother with an active approach if it can't beat a passive rockbottom cost tracker?

And more importantly, you need to track the results over 15 years or so to make any statistically relevant conclusions about your method. Short term trends (one way or the other) could just be luck (good or bad) rather than method.

It is not my method, it is Greenblatts method that he tested over a longer period than that. I'm just applying it.

Given that his tests using his method claim outperformance vs. S&P 500 on a horizon of 3-5 years AND always outperformance (in any year he tested) if you select smaller stocks (out of a qualifying selection of 50) there is a clear difference between his claims and my results.

If predictions (claims) don't pan out, there is no need to keep testing it.

Given that my actual results differ from what he claims should be my results I'm not putting money on the line at this point. I will continue to follow and see if he gets vindicated. If so I'll probably resume and apologize to mr. Greenblatt. Although I'm sure he doesn't care too much :)
 
Cool to see someone else ran an experiment too!

What I did is go here: https://www.magicformulainvesting.com/
and then take the top 30 stocks with 50m market cap. That way I didn't have to run all the screens myself.

I use the same website and screen.

Two differences in application: I took the smallest 20 (by market cap) out of the top 50 selection. And I buy/sell them all at once vs. 5 a quarter. I do keep the shares for a bit over a year, just as he proposes.

The first difference he says in the book don't matter - you are still selecting from the "50 best" choices out there. The second difference he doesn't comment on. However, I do think that if that change (buy at once vs. quarter) causes such a drastic deviation that the method isn't robust enough to begin with.

I am aware of his 3-5 year claim, which is I why I'll keep tracking. If the approach makes a strong comeback I'll reassess.

I'm seeing too many question marks in my head now though to put real money in it. Won't regret if Greenblatt wins after all.
 
Seems to me that your value oriented stocks just came more value oriented. I would have expected a "stick with the same 50 stocks and double down in year 2"...
 
Given that my baseline alternative is to invest in the S&P 500 it is the right benchmark for me. I am not trying to outperform the mid-cap or small cap index. Greenblatt also uses the S&P 500 as his yardstick. Why bother with an active approach if it can't beat a passive rockbottom cost tracker?

Except, your method takes on way more risk than the S&P500. Smallcaps will (over the long term) outperform the S&P500 but what a wild ride you'll have. Troubled companies should also outperform the S&P500 provided they stay in business. Ditto on the wild ride though.

Anyone can "Bet the Farm" and sometimes come out ahead. But what takes real talent is to look at risk-normalized returns and come up with a superior method.

It is not my method, it is Greenblatts method that he tested over a longer period than that. I'm just applying it.

It is Your method in that you (apparently) believe in it enough to put your hard earned money in it.

Given that his tests using his method claim outperformance vs. S&P 500 on a horizon of 3-5 years AND always outperformance (in any year he tested) if you select smaller stocks (out of a qualifying selection of 50) there is a clear difference between his claims and my results.

Again ... Performance must be measured against the risk baseline.

Otherwise apples and oranges.
 
Not sure we are talking in the same terms here. Are you familiar with Greenblatt and the book I am referencing?

I am familiar with the supposed premium and higher volatility of small caps as a class. The whole point of his approach however is to get lower volatility and certainly downside risk with a higher return, vs the S&P 500. So this wild ride is not supposed to happen.

Just as an illustration: none of his years employing this approach in small caps returned negative results, and only a few years were lagging the S&P 500 by a few percent.
 
I think to get the lower volatility, you need to have 30 or so at any time.

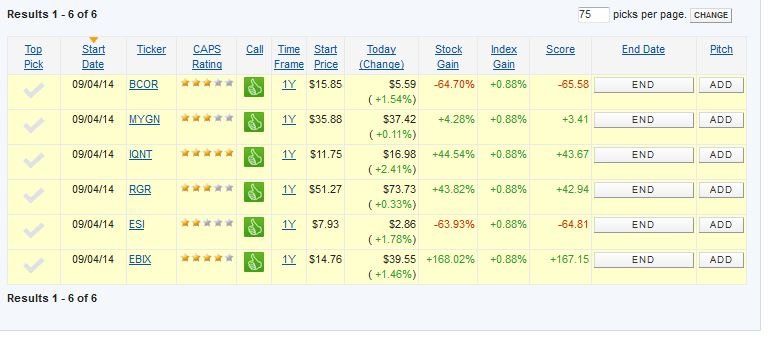
I thought maybe I'd model it in Motley Fool CAPS, but after I started, I realized that it would be almost as much work to do that as do it for real. But I did pick six stocks almost exactly 1.5 years ago (see image).

My plan was to buy 6 stocks every 2 months and sell all stocks when they reached a one-year holding period. Each buy was to be about $2800 so after a year (6 sets of 6), I'd be in for $100K.

If I had done it on 9/4/2014, I'd have had an annualized return of 16% (if I did that calculation right).

Price Then 9/4/2014SharesInvestedPrice NowValue
15.8529459.655.59162.11
35.8813466.4437.42486.46
11.754047016.98679.2
51.279461.4373.73663.57
7.9359467.872.86168.74
14.7632472.3239.551265.6
2797.713425.68
There's a guy on there called "TrackJGreenblatt" that has 280 or so stocks picked over several years, but trying to analyze it threw my for a loop.

Oh, one more thing I found out. Vanguard looks like it might be the cheapest place to do this...$2 per trade. I checked some of the unlimited trade deals, but they had strings attached, fees, and stuff that made it not worth it. The first year I'd spend $72 and each continuing year I'd spend $144. Round trip on each stock takes me down to 12%, but I'll take that!
 

Attachments

  • caps.JPG
    caps.JPG
    52.7 KB · Views: 11
Last edited:
I ran "TrackJGreenblatt" data. The tool isn't a portfolio simulator, so only the buy and sell dates and prices are listed. I did the rest in a spreadsheet. Presuming $2 per trade, he turned 100 into 182 from 10/15/2007 until yesterday. The sheet comes out with a 9.1% XIRR.

I know it's not apples to apples, but the S&P turned 100 into 141 over that span (IRR of 4% or so).

I modeled that he put in 1/6th of the original stake every 2 months the first 12 months, so the first year he averaged only half-invested. I modeled he sold out everything yesterday.

Oh, and I didn't include dividends for the magic formula XIRR, only because it would have required too much lookup work.
 
Last edited:
Interesting, thanks for finding that info.

Could you maybe post returns next year of a (virtual) selection again? Will do the same.

Might be my portfolio selection method is flawed, specifically the annual cycle.

Also, any idea how the TrackJGreenBlatt person got his stock selections and whether there is a survivor bias at work?
 
The system on motley fool is a competition, and so doesn't allow for cheating. I was unable to find anyone else that did an experiment and quit, if that's what you mean by survivorship bias. The guy documented each selection when he made it...pulled 30 from the magic formula web site and used a random sort web site to select 5 or 6.

It went crazy down in 2008, but bounced back. Unfortunately I was unable to calculate continuous portfolio value, so no graph.

He documented his entire pull of 30 each time, so those could be used to generate another run, but the prices would have to be looked up, which would be a lot of clicks. If I can figure out how to automate that part, I might try it.
 
Back
Top Bottom