You are using an out of date browser. It may not display this or other websites correctly.
You should upgrade or use an alternative browser.
You should upgrade or use an alternative browser.
Dividend paying stocks
- Thread starter JP.mpls
- Start date
marko
Give me a museum and I'll fill it. (Picasso) Give me a forum ...
- Joined
- Mar 16, 2011
- Messages
- 8,509
The div fund reliably kicks off 4% / $40,000 a year in divs (once a year, again for simplicity) which come from its $40,000 of income, and it maintains its per share value year after year. As your $1M portfolio approaches the ex-div date it is worth $1,040,000. After paying out a 4% div to everyone, the value of the portfolio drops back to $1M. And we assume this continues in perpetuity.
OK so far?
Now if we give the same attributes to a zero-div fund, it also approaches $1,040,000 after a year, which come from its identical $40,000 of income. But there is no div, so no ex-div date, so it retains its value. So we sell $40,000 worth, and since it is now $104 per share, we sell fewer than 400 shares (384.615384615385 shares per my calcs).
So if you extend this out, yes indeed, you get to the point of owning a single share (236 years later...)! But (drum roll...) that share is worth $1M!
-ERD50
Yes! And no beef here.
Of course in actual practice, a non-div payer and a div payer do grow in value over time but your example here is clear and straightforward!
ERD50
Give me a museum and I'll fill it. (Picasso) Give me a forum ...
Yes! And no beef here.
Of course in actual practice, a non-div payer and a div payer do grow in value over time but your example here is clear and straightforward!
Glad it helped.
"Where's the beef" isn't an argument/complaint type "beef". It's from an old-old-old commercial for hamburgers (Wendy's? - yes), looking for the tiny patty of beef on competitor's burgers. IOW, where is the substance? Where are the supposed gains from div-payers?
https://en.wikipedia.org/wiki/Where's_the_beef?
"Where's the beef?" is a catchphrase in the United States and Canada introduced in 1984. The phrase originated as a slogan for the fast food chain Wendy's. Since then it has become an all-purpose phrase questioning the substance of an idea, event or product.[1]
-ERD50
Luck_Club
Full time employment: Posting here.
- Joined
- Dec 5, 2016
- Messages
- 733
OK, I started putting together a spreadsheet, and as soon as I put the formulas together, the answer is obvious. Well, obvious to me - now how to explain it...
To make this apples-apples, we of course have to assume that we have two funds, the same in every other way, except one pays divs, the other does not. Let's start with $1M and $40,000 divs or sales, and keep inflation at zero for simplicity. The fund manager set the IPO at $100/sh, so we bought 10,000 shares.
The div fund reliably kicks off 4% / $40,000 a year in divs (once a year, again for simplicity) which come from its $40,000 of income, and it maintains its per share value year after year. As your $1M portfolio approaches the ex-div date it is worth $1,040,000. After paying out a 4% div to everyone, the value of the portfolio drops back to $1M. And we assume this continues in perpetuity.
OK so far?
Now if we give the same attributes to a zero-div fund, it also approaches $1,040,000 after a year, which come from its identical $40,000 of income. But there is no div, so no ex-div date, so it retains its value. So we sell $40,000 worth, and since it is now $104 per share, we sell fewer than 400 shares (384.615384615385 shares per my calcs).
So if you extend this out, yes indeed, you get to the point of owning a single share (236 years later...)! But (drum roll...) that share is worth $1M!
Another way to think if it, if you didn't sell, your portfolio would increase by $40,000 every year, because that income is retained in the fund and reflected in the NAV.
All this is just restating what was said before, but sometimes a fresh angle is what it takes for the light to come on.
In essence, it seems that any claims about the div-payers being superior is based on circular logic that they are better (they provide steady income, they don't go down as much, etc, etc)! The divs don't make a difference, but some assumption of superior performance will of course, show them to be superior. And if they are superior, then we should see it in the charts. Where's the beef?
-ERD50
Since you already have the spread sheet. Adjust a 35% market drop in year 1 then run it out, pulling the same 40,000 each year. After 10 years plop multiply the balance remaining by 1.55, and let us know where you end up. at year 20.
foxfirev5
Thinks s/he gets paid by the post
- Joined
- Mar 22, 2009
- Messages
- 2,991
I've discovered the solution to the debate is simple. My allocation of 1/3 to CD's. 1/3 to Bond funds, 1/3 to Dividend ETF's and another 1/3 to Total Stock Market provides me with more than I'll ever need.
FIREmenow
Full time employment: Posting here.
- Joined
- May 9, 2013
- Messages
- 756
I've discovered the solution to the debate is simple. My allocation of 1/3 to CD's. 1/3 to Bond funds, 1/3 to Dividend ETF's and another 1/3 to Total Stock Market provides me with more than I'll ever need.
.....by about 33%? Nice.
ERD50
Give me a museum and I'll fill it. (Picasso) Give me a forum ...
Since you already have the spread sheet. Adjust a 35% market drop in year 1 then run it out, pulling the same 40,000 each year. After 10 years plop multiply the balance remaining by 1.55, and let us know where you end up. at year 20.
With my spreadsheet, they will both end up at exactly the same place. $104 minus $4 in dividends, or $104 minus $4 in sales is the same thing. Pesky Arithmetic!
But if you want to see how a market downturn affected these while taking 4% withdrawals in the real-life 2008 debacle, go back to my posts #49 and #51. Not much difference in the div-funds vs Total Market.
-ERD50
joylesshusband
Recycles dryer sheets
- Joined
- Oct 15, 2015
- Messages
- 138
I've discovered the solution to the debate is simple. My allocation of 1/3 to CD's. 1/3 to Bond funds, 1/3 to Dividend ETF's and another 1/3 to Total Stock Market provides me with more than I'll ever need.

Reminds me of my diet in the teenage years: 40% of the daily ration during breakfast, 30% for lunch, and the other 60% - at dinner...
ncbill
Thinks s/he gets paid by the post
I read the paper. You are correct it didn't directly compare dividend payers to a total market strategy. However, it did evaluate the total market across 4 criteria, identifying 2 sub categories that showed lower risk and higher returns then the other 2 sub categories.
By the very fact that when you are buying the total market you are also buying the two under performing categories which would result in a lower over all return wouldn't it? Or am I missing something here?
So as others have said "it just feels safer" is now fully explained in a highly technical paper.
^^^^^^^ This
This subject has been beaten to death over at bogleheads as well.
And as they also concluded, for many dividend stocks meet an emotional need.
^^^ ^^^ ^^^
It was a circuitous journey to get back to this place. Didn't even need no stinkin' spreadsheet (though it was helpful).
Maybe this will help (or not):
It's not an apples-to-apples comparison, it's more of an apples-to-mashed potatoes comparison. Dividend stocks are more like comfort food--soothing. Basically, that's the feeling. You can count on them to be fairly predictable, yet less profitable for most dividend investors (me included).
I don't think that you will find any clear measurable advantage to the dividend payers. I haven't. However, I have found a place in my portfolio for them.
It was a circuitous journey to get back to this place. Didn't even need no stinkin' spreadsheet (though it was helpful).
ERD50
Give me a museum and I'll fill it. (Picasso) Give me a forum ...
^^^ ^^^ ^^^
It was a circuitous journey to get back to this place. Didn't even need no stinkin' spreadsheet (though it was helpful).
Sorry, but I still don't think the ends of the circle connect. The spreadsheet just demonstrated a principle, it doesn't say anything about actual performance of any group of stocks.
I just don't see the evidence that (compared to the Total Market), "You can count on them to be fairly predictable, yet less profitable for most dividend investors".
I know that paper seems to say that, but I'd be more convinced if they actually just showed the performance returns plotted against the Total Market. Instead, they are plotting stats, going back to 1964 I think. OK, long term performance is important, but we also have to consider that things might have changed with the wide-spread availability of broad-based funds in the past few decades. Could those numbers count on 60's-70's-80's era performance? An actual performance chart would let us see that - why didn't they include it?
And if div-payers are "comforting", why doesn't that show itself in my charts over the past 10 years, which do include a huge drop and huge recovery? The div payers didn't exhibit much, if any 'comfort' that I can see.
-ERD50
YOC is not only non-useful, it is meaningless. You divide the dividend at one point in time by the price at another arbitraty point in time. Meaningless.YOC is another non-useful measurement. Money is fungible. The current value could be moved to another investment. The future outlook of a stock is not changed because one person bought it @ $10, and another bought it @ $50.
The latter.Were these stocks picked in 2001 (as far back as the analysis went), or are they current picks based on current results (survivor bias)?
I used to debate/discuss with DGI folks that loved Fish's data. I pointed out that something like half of the stocks on the oldest list were not on the most recent list. Almost half of them had dropped off (some due to mergers & buyouts) Nobody wanted to answer my question of how you pick the stocks to buy today that will still be on the list in 10 years.
Everybody wanted to just assume that they would only pick winners.
It's all emotional and feel-goodism. Dividends feel like free money -- and that's that.
What we really need (and it seems it should be available, somewhere?) is what I mentioned earlier - the list of recommendations made back at the time -
Historical Dividend Champions spreadsheets:
David Fish's lists of Dividend Champions, Contenders, and Challengers
The oldest one is Dec 2007. http://www.tessellation.com/david_fish/071231.xls
I downloaded them all a few years ago when I was seriously investigating DGI. Note to myself in 2016: "Note: 2016 CCC summary tab shows 133 Champs on Dec 2007, and 36 of them have dropped off the list. This is 27%."
This was symbol comparisons only, so it overstates the number that dropped off. For example, Walgreens symbol went from WAG to WBA. By that point, I had seen enough to be reject DGI as a good investment idea so I didn't look closer to clean it up.
ERD50
Give me a museum and I'll fill it. (Picasso) Give me a forum ...
Historical Dividend Champions spreadsheets:
David Fish's lists of Dividend Champions, Contenders, and Challengers
The oldest one is Dec 2007. http://www.tessellation.com/david_fish/071231.xls
I downloaded them all a few years ago when I was seriously investigating DGI. Note to myself in 2016: "Note: 2016 CCC summary tab shows 133 Champs on Dec 2007, and 36 of them have dropped off the list. This is 27%."
This was symbol comparisons only, so it overstates the number that dropped off. For example, Walgreens symbol went from WAG to WBA. By that point, I had seen enough to be reject DGI as a good investment idea so I didn't look closer to clean it up.
It pays to be skeptical.
When I looked at that site, I saw lots of "how to select", "how to buy", "how to track", etc. What I didn't see was how the old picks performed going forward. Now if that was something to brag about, why not show it? Occam's Razor suggests the answer, that there is nothing worth showing (to their intended audience).
If the returns were lower, but with less volatility, that might fit some people's needs, but we don't even see that. And how would that compare with a selected AA?
-ERD50
ncbill
Thinks s/he gets paid by the post
Historical Dividend Champions spreadsheets:
David Fish's lists of Dividend Champions, Contenders, and Challengers
The oldest one is Dec 2007. http://www.tessellation.com/david_fish/071231.xls
I downloaded them all a few years ago when I was seriously investigating DGI. Note to myself in 2016: "Note: 2016 CCC summary tab shows 133 Champs on Dec 2007, and 36 of them have dropped off the list. This is 27%."
This was symbol comparisons only, so it overstates the number that dropped off. For example, Walgreens symbol went from WAG to WBA. By that point, I had seen enough to be reject DGI as a good investment idea so I didn't look closer to clean it up.
"Don't gamble; take all your savings and buy some good stock and hold it till it goes up, then sell it.
If it don't go up, don't buy it."
- Will Rogers
What I didn't see was how the old picks performed going forward. Now if that was something to brag about, why not show it? Occam's Razor suggests the answer, that there is nothing worth showing (to their intended audience).
-ERD50
It's not that they found that there is nothing worth showing. It's that they are assuming that DGI stocks are superior and therefore there is no need to look at any actual data.
Just like we see here in this thread. Declaring that dividend stocks are simply better and thus there is no need to even consider what stupid spreadsheets might say.
You can't get them to pay any attention to your "48+2 == 50" statement. They don't even bother to refute it, they just ignore it completely.
For the record, I originally thought all those things about DG stocks that they are touting, but changed my mind when I ran some backtests.
They really and truly believe in their heart of hearts that dividends are free money. Because the only way that what they believe could be true is if dividends were free money. It's a psychological and mental/emotional thing.
I once reasoned that it could not be correct that dividend-paying stocks had better return than the equivalent non-dividend-paying stocks. The stock market is chock full of very smart, very talented, very hungry people who claw for every little advantage they can find. What is the chance that these people would be ignoring a bit of superior risk-free money which they and all their super-computers somehow can't see but which is obvious to small part-time pajama-clad investors?
It's not like David Fish's DGI spreadsheet is hidden from the attention of Goldman Sachs and Blackstone. So why haven't they set up a mutual fund or hedge fund that buys these stocks and achieves the (presumed) superior performance?
What is the chance that these people would be ignoring a bit of superior risk-free money which they and all their super-computers somehow can't see but which is obvious to small part-time pajama-clad investors?
Uh, oh, it sounds like you've started peeping through bedroom windows again.
accountingsucks
Recycles dryer sheets
- Joined
- Jan 28, 2006
- Messages
- 346
This thread hit home to me as I was always a DGI investor. I am in Canada and many of our stalwart stocks pay great dividends. Banks, telcos, pipelines and utilities are heavily sprinkle into my portfolio. I always thought how can i go wrong with this stock paying 4% with 2-3% upside I did read about Total Returns being more important but like others ignored it as I thought hey I could live on those dividends down the road.
That was the wrong thought process as a 30 something and it has literally cost me hundreds of thousands of dollars. I have slowly been trying to eliminate my home bias in Canada and buying the world indices which by default moves me from a DGI investor to a Total Return guy. I do not believe a DGI heavy portfolio would soften the blow on any correction - perhaps in the utilities sector it would but that's about it.
The 48+2 poster has it right.
I did read about Total Returns being more important but like others ignored it as I thought hey I could live on those dividends down the road. That was the wrong thought process as a 30 something and it has literally cost me hundreds of thousands of dollars. I have slowly been trying to eliminate my home bias in Canada and buying the world indices which by default moves me from a DGI investor to a Total Return guy. I do not believe a DGI heavy portfolio would soften the blow on any correction - perhaps in the utilities sector it would but that's about it.
The 48+2 poster has it right.
Luck_Club
Full time employment: Posting here.
- Joined
- Dec 5, 2016
- Messages
- 733
I'm not convinced we have  . I've been running several random scenarios with various portfolios against VTI. Some general observations:
1) The heavily concentrated dividend portfolios are producing slightly better results then the VTI. 8.47% Vs 8.17% CAGR
2) The risk of the heavily concentrated dividend portfolios is actually less than VTI, according to the Sharpe & Sorintino ratios.
3) The max draw down is less with the dividend portfolios. 14.73% Vs 36.98%
It would be interesting if we could find the VTI stocks that paid a dividend at the inception of the portfolio and back test an equal weighted portfolio of only those stocks that had the middle of the road dividend payers as mentioned in the paper referenced earlier.
Playing around with this tool. Thank you ERD50! I've been able to get some nice results for lower risk portfolios.
https://www.portfoliovisualizer.com/backtest-portfolio#analysisResults
. I've been running several random scenarios with various portfolios against VTI. Some general observations:1) The heavily concentrated dividend portfolios are producing slightly better results then the VTI. 8.47% Vs 8.17% CAGR
2) The risk of the heavily concentrated dividend portfolios is actually less than VTI, according to the Sharpe & Sorintino ratios.
3) The max draw down is less with the dividend portfolios. 14.73% Vs 36.98%
It would be interesting if we could find the VTI stocks that paid a dividend at the inception of the portfolio and back test an equal weighted portfolio of only those stocks that had the middle of the road dividend payers as mentioned in the paper referenced earlier.
Playing around with this tool. Thank you ERD50! I've been able to get some nice results for lower risk portfolios.
https://www.portfoliovisualizer.com/backtest-portfolio#analysisResults
ERD50
Give me a museum and I'll fill it. (Picasso) Give me a forum ...
I'm not convinced we have
1) The heavily concentrated dividend portfolios are producing slightly better results then the VTI. 8.47% Vs 8.17% CAGR
2) The risk of the heavily concentrated dividend portfolios is actually less than VTI, according to the Sharpe & Sorintino ratios.
3) The max draw down is less with the dividend portfolios. 14.73% Vs 36.98%
It would be interesting if we could find the VTI stocks that paid a dividend at the inception of the portfolio and back test an equal weighted portfolio of only those stocks that had the middle of the road dividend payers as mentioned in the paper referenced earlier.
Playing around with this tool. Thank you ERD50! I've been able to get some nice results for lower risk portfolios.
https://www.portfoliovisualizer.com/backtest-portfolio#analysisResults
Did you mean to include your comparisons in that link? What you posted is just a blank starting point. To post your selections, make all your entries, hit the "Analyze" button, and then you need to hit the "link" button that will show up under that.
What methodology did you use to select your div-payers? Hopefully they were selected based on that at the start of your study, not another backwards-looking pick of current 'winners'.
And even at that, a sector may or may not outperform the 'market' over any given time frame. The key for me is, can I easily replicate it, and is it reasonable to expect it to outperform over the long term?
-ERD50
Snidely Whiplash
Recycles dryer sheets
- Joined
- Apr 12, 2009
- Messages
- 206
Warren Buffet makes the an argument against dividends in his 2012 Berkshire Hathaway annual shareholder letter starting on page #19.
http://www.berkshirehathaway.com/letters/2012ltr.pdf
I admit I have a hard time getting my head around this too. I guess its a lack of math skills on my part but how does one refrain from eventually selling the hypothetical total return fund down to a single share? With VFIAX partial shares can be sold to equal a non-share specific amount so I guess its not so much an issue unless you are talking about an ETF or non-dividend paying stock.
(On a personal level, I don't know which of the 2 strategies argued here will do best over the next 30 years, so my personal portfolio has a nice blend of both dividend blue-chip stocks and the S&P 500 index fund)
http://www.berkshirehathaway.com/letters/2012ltr.pdf
I think where people get stuck is this:
If you own a TR that were to pay no dividends, every time you need cash you must sell from your total fixed set of shares. In theory you could eventually sell down and end up with 1 share. That share may eventually grow to $50K but if you need $50K, then what?
I admit I have a hard time getting my head around this too. I guess its a lack of math skills on my part but how does one refrain from eventually selling the hypothetical total return fund down to a single share? With VFIAX partial shares can be sold to equal a non-share specific amount so I guess its not so much an issue unless you are talking about an ETF or non-dividend paying stock.
(On a personal level, I don't know which of the 2 strategies argued here will do best over the next 30 years, so my personal portfolio has a nice blend of both dividend blue-chip stocks and the S&P 500 index fund)
ERD50
Give me a museum and I'll fill it. (Picasso) Give me a forum ...
I covered this in post #150. Yes, a $1M portfolio of 10,000 shares goes down to 1 share after around 235 years, but that 1 share is worth $1M.Warren Buffet makes the an argument against dividends in his 2012 Berkshire Hathaway annual shareholder letter starting on page #19.
http://www.berkshirehathaway.com/letters/2012ltr.pdf
I admit I have a hard time getting my head around this too. I guess its a lack of math skills on my part but how does one refrain from eventually selling the hypothetical total return fund down to a single share? With VFIAX partial shares can be sold to equal a non-share specific amount so I guess its not so much an issue unless you are talking about an ETF or non-dividend paying stock. ...
Here's the spreadsheet, scroll down to year 235...
-ERD50
Attachments
- Joined
- Oct 13, 2010
- Messages
- 10,797
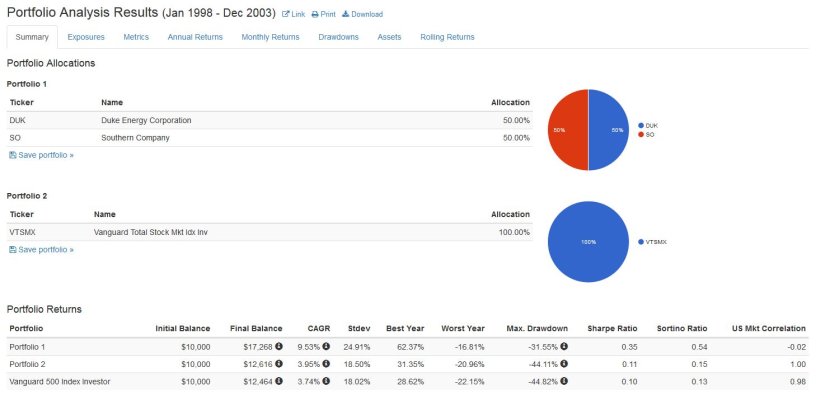
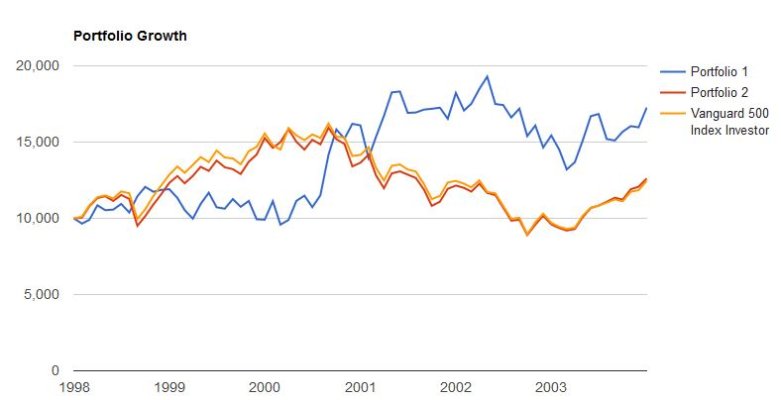
The two stocks in portfolio 1 were actually held during this span of time. Portfolio 2 is total market. One might say I "cherry picked" the specific 6 year span, but it's really the only span I ran. That's the first time I've been to that site. Nice! I really don't know how it would look on other spans. I certainly picked the span with the 2000 bear market in mind because, for my mom and her utility stocks, we don't want to have to wait too many years for the total market to recover.
Attachments
Last edited:
ERD50
Give me a museum and I'll fill it. (Picasso) Give me a forum ...
The two stocks in portfolio 1 were actually held during this span of time. Portfolio 2 is total market. One might say I "cherry picked" the specific 6 year span, but it's really the only span I ran. That's the first time I've been to that site. Nice! I really don't know how it would look on other spans. I certainly picked the span with the 2000 bear market in mind because, for my mom and her utility stocks, we don't want to have to wait too many years for the total market to recover.
You aren't seriously trying to make a point with a portfolio of two stocks, are you? I'll accept that you actually held those in that time frame, but how does that help anyone else?
I can do that too (no cherry-picking on my part, I just like stocks that start with "A") :
Code:
Portfolio Analysis Results (Jan 1998 - Dec 2017)
Portfolio Returns

#    Initial Balance    Final Balance    CAGR
1    $1,000,000      $4,181,343          7.42%     VTSMX
2    $1,000,000      $6,165,966          9.52%     DUK,SO
3 $1,000,000 [B]$317,843,833 [/B] 33.39% AAPL,AMZNSimilar threads
- Replies
- 7
- Views
- 771
- Replies
- 51
- Views
- 3K