Seven-year average percentage growth

I know...have to not get caught up in "I should have done...."


Bottom line after 6.5 years my portfolio is up ~45% including withdrawals since January 2017

I was just thinking about the withdrawal aspect. Do most folks calculate like FREE866 - IOW including their withdrawals? Or do you exclude withdrawals?

I don't pay a lot of attention to my growth, but just check NW once a year. I don't exclude withdrawals which have gotten significantly higher of late, and yet my stash continues to climb fairly consistently. Even as stocks (in general) have slid over the past couple of years, my NW continues to grow - for the most part because my old Megacorp stock that I didn't get rid of following FIRE has been on a tear. If all my investments did that well, I'd be a millionaire. Wait! I AM a millionaire. Never mind.:cool:
 
I was just thinking about the withdrawal aspect. Do most folks calculate like FREE866 - IOW including their withdrawals? Or do you exclude withdrawals?
:

IMO, your net (growth minus withdrawals) is just as important. I track both annually and have been for 20 years on my notorious Excel sheets.

This is how TRPrice, Fido and most others calculate a "Personal Rate of Return". According to them, my PRR is 6.5% from incept.

Obviously, the net is a much smaller number but as long as it's positive or flat over a span of time--not necessarily YOY-- I think/know I'm heading in the right direction.

Great to have an X% growth, but if your net is constantly going negative, that should be a red flag.
 
6.1% annualized IRR over 7 years.

I do track annual change in the balance AFTER withdrawals and it's gone up an average of 2.4% per year in the 9 years since I retired- a simple metric that tells me my withdrawals are sustainable.
 
6.1% annualized IRR over 7 years.

I do track annual change in the balance AFTER withdrawals and it's gone up an average of 2.4% per year in the 9 years since I retired- a simple metric that tells me my withdrawals are sustainable.

Exactly!
 
I retired 2/2016.

I used to track this monthly, but once I decided I was WAY ahead, I stopped wasting my time.

In rough numbers, after subtracting out our spend, we are up about 80% in that time.

I'll take that.
 
Since retirement 6 years ago without adjusting for inflation, started with 2m have 3.2m after drawing $50k/yr.

With investments spread between 65% large cap, 20% small cap, 10% international index and remainder in cash.

Easiest money I've ever made.


That’s amazing.
 
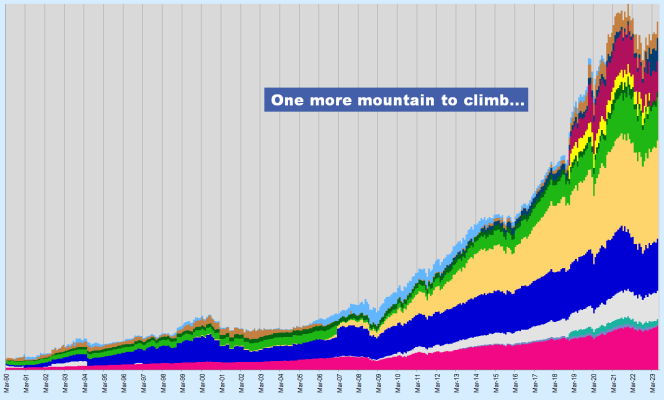
One more mountain to climb

Funny how the very deep valleys of the past fade into memory.

It's mostly mountains now!
 

Attachments

  • Capture.PNG
    Capture.PNG
    62.8 KB · Views: 59
Funny how the very deep valleys of the past fade into memory.

It's mostly mountains now!

Mine doesn't have quite the peaks yours does, but I agree- I look back at the bear markets and they're a blip. It helps me ride out future ones. I started tracking net worth in 1991 but the values really took off starting in 2003, when I married second DH after divorcing my financial train wreck of a first husband in 1997 and living as a single mother in a HCOL area. We moved to KS for my job, sold our houses in NJ and invested most of the proceeds, and shared similar financial priorities.
 
Mine doesn't have quite the peaks yours does, but I agree- I look back at the bear markets and they're a blip. It helps me ride out future ones. I started tracking net worth in 1991 but the values really took off starting in 2003, when I married second DH after divorcing my financial train wreck of a first husband in 1997 and living as a single mother in a HCOL area. We moved to KS for my job, sold our houses in NJ and invested most of the proceeds, and shared similar financial priorities.
You change the y axis to be what you want! Taller, smaller, what have you!

Since 2000, crazy times for most.
 
Very interesting chart.

I do know at least from the last 10 years a person would have done better with money not in their defined pension plan but instead having that money invested from a lump sum.

I did way better having the money in the market working for me instead of continuing working and having the defined plan.

Not sure that was described clearly but the markets have been very good for ER people in the last 10 if invested properly.
 
I used to track my net worth (in quite a bit of detail) daily long ago while working for mega-corp and hoping to be FIRE. After I "retired" (2009), I kept it up for a while, but eventually lost interest in doing so. Ironically, that was just about 10 years ago (end of May 2013). CAGR from that period to now is 5.42%, CAGR from when I retired to now is 6.86%.

Neither of the above are super accurate, as I eventually started working part time, then ended up becoming a full time prof in 2014, but a low paying one (community college). In that period I've also made it a point to spend a lot more than I used to (child, bought property, multiple trucks and cars, RV, and so on). So I don't exactly (or even approximately know) the net flow in/out (which isn't included in those calculations), but I would suspect I've been spending all of my net job $ and mega-corp pension PLUS. It is hard to figure out as I had been putting away (457 plan) some of that pay, but also selling things here and there to augment my pension.

Some of this was me just trying to not obsess on it, that is when I retired in 2009 I figured I had "enough", so if I could sort of stay at that level or better then all would be OK (at least in terms of money). Given I am 2.5X of what I had May 2009 AND I can now get social security if desired, I'd say it worked out fine. [The spending of money can especially be seen by comparing my non-tax-deferred account value change % in contrast to the 2.5X overall. These are up 1.5X vs. 2.5X, even though I've had some great winners in them like AAPL, MSFT, EW, HON, ABT/ABBV, MAR. That's because those accounts have been a source of funds for the many things bought/done over those years.]
 
It would take a bit of work for me to compute the IRR with a spreadsheet, because I make irregular withdrawals for spending throughout the years, and the withdrawals have to be accounted for.

Despite being a Quicken user for many years, I only recently discovered that the program could compute the IRR over any selected period with just a few clicks. And as I track all of my investment accounts inside Quicken, the number it computes encompasses my entire stash, everything.

To do it: Investing -> Reports -> Investment Performance. Then, enter in the desired period.

For 7/25/2016 to 7/25/2023, Quicken computes my IRR as 11.05%.

The S&P CAGR was 13.18% in the same period. My stock AA varied and was from 60% to 80+%.


PS. Some additional observations:

From 7/2016 to 7/2023, my stash grew to 1.886x. If I did not withdraw any money, then using the CAGR from Quicken, it would have grown 1.1105^7 = 2.083x. The difference is due to withdrawals, of course.


Then, using Quicken again to look at my withdrawals over the last 7 years, I found out that they totaled to 12.9% of the portfolio value in 7/2016, with inflation ignored.
 
Last edited:
While still w*rking, I still recall the first time I realized my stash was making more money than I was! Why didn't I quit the next day? I was having too much fun.
Late in seeing your comment. I reached another milestone similar to your observation; back in college in 1987 i worked 3 jobs one summer to save $3000. One job especially stands out as it involved hard physical labor--landscaping at the University. A decade later, I saw that I had made more in capital gains from doing nothing. It was a joyous moment.
 
I retired 7 years ago Apr 3, 2017 at age 51. My net worth (investable assets) has more than doubled, up 127% in total. Thats all I know. No pension either, I'm living off my investable assets.
 
Last edited:
I'm not fully retired, but my plan is for my net growth to soon go negative and stay that way, until I slide into the grave with just enough to pay the undertaker, as they say. Except for those who aim to leave a legacy to heirs, who can't find enough things to Blow That Dough on?
 
We're up 92% since I retired 8 years ago. That averages out to an 8.47% annual growth in NW. DW has worked much of that 8 years, however, so withdrawals have been fairly minor up to now.
 
Not FIRED so we are still adding to the pot. Last 7 year CAGR was 12.5% which includes savings and growth.
 
Schwab's portfolio performance tab has a Rate of Return. Mine says "Your portfolio had a cumulative rate of return of 89.13% from Dec 31, 2016 to May 22, 2024. (Annualized: 9.00%)"
 
We have been retired just over 10 years with only SS and investments to live on. Over the last 7 years our portfolio has increased by an average of 5.72%. That percentage is after taking out needed living expenses beyond what SS covers. We have not started taking RMDs from tax deferred investments.
 
I don't have the numbers to calculate my real return. I have return after spending down my portfolio. I'm up on average 3% a year. We both start SS in 7 months, SS plus dividends on my taxable accounts will be more than enough to cover our spending. Then I won't need to touch my tIRAs, SEP/IRAs, Roth/IRAs or, the principal in taxable accounts. Hopefully things will grow much faster then. My kids will be rich, (dependent on how rich is defined) :) I often quibble online with people about what rich and wealthy actually mean, I don't have the answer!
 
Back
Top Bottom