10 Charts About Retirement Every Retiree Should See (2020)

Wow, these charts (and the ones in the full report) are "fully packed" with interesting, thought provoking information. Thanks Midpack!!!!!

-BB
 
Hmm...chart #7 on Average Spending by Age & Category doesn’t list Taxes as a spending category?

It’s our largest one (Fed, State, Property)
 
It would be interesting to see what the SS payout at 62 with a 7% annual compounding return would be worth @90

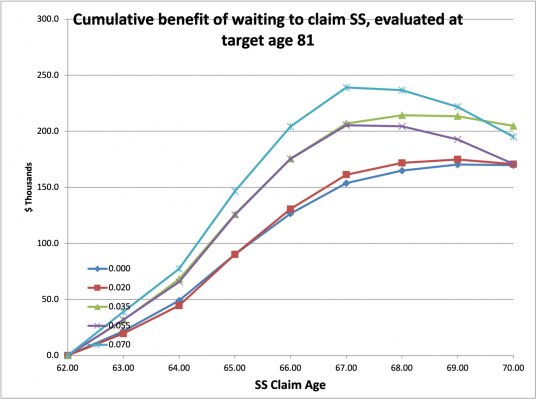
For my situation, MFJ with wife filing spousal at 67, this is my year by year result of waiting at different discount rates, all $ are inflation adjusted. I hit the maximum contribution nearly every year and the graphs are specific to my retirement RMDs, Roth conversions, so YMMV, but the trend will be roughly the same.

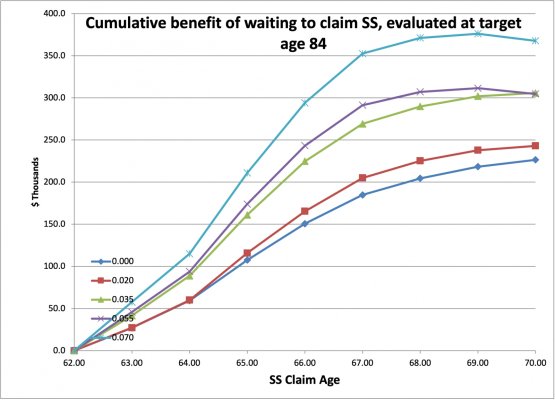
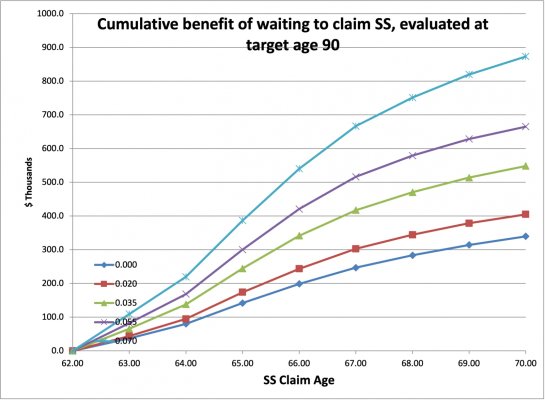
Generally, if one of us will make it to age 81, I should wait until my FRA to claim and each year after 81 adds about a year to the optimum, so by age 84, it's a slight benefit to wait to age 70 (at discount rates I tested between 0-7%). For married folks, the statistics are that one of you is likely to live a long time. So the person with the bigger benefit should wait if they can.
 

Attachments

  • SS 81.jpg
    SS 81.jpg
    271.2 KB · Views: 55
  • SS 84.jpg
    SS 84.jpg
    278.6 KB · Views: 54
  • SS 90.jpg
    SS 90.jpg
    294 KB · Views: 53
Great collection of info... printed and in my retirement notebook.
 
Back
Top Bottom