10 vs. 20 ?

Mysto

Recycles dryer sheets
Joined
Mar 13, 2006
Messages
206
I am curious why failure rates increase (smaller balance) with shorter time periods.

Example:
Spending $10K a year
Portfolio $500K
20 Years.
Portfolio 50% Stocks 50% Commercial Paper.

Results Min 385K

Same calculation except time period is 10 years

Results Min 284K

This does not appear to be so with every input value. I'm a bit concerned because I am seeing this in my personal calculations.
 
It's a function of math and probability.

There are far more 10 year periods than 20 year periods. There are even fewer periods of 30 and 40 years. When you input a shorter period you are analyzing a bigger (and more reliable) sample. When you pick a longer period, and a smaller sample, the probability of selecting an outlier that skews the results is higher.
 
I thought so too but if I increase the spending to 20K for example the situation changes.

10 years 200K
20 years 104K

?
 
It might also speak to the need to have your equity investment sit in the market through more so-called 'business cycles'.

I know from personal experience that the money I so ignorantly invested in a front-end-load fund about 30 years ago would not have done as well as it has if I had pulled it out at 10 years.
 
I
Results Min 385K

Same calculation except time period is 10 years

Results Min 284K

You listed min $ rather than the failure rate, which appears to be 0% in both cases.
 
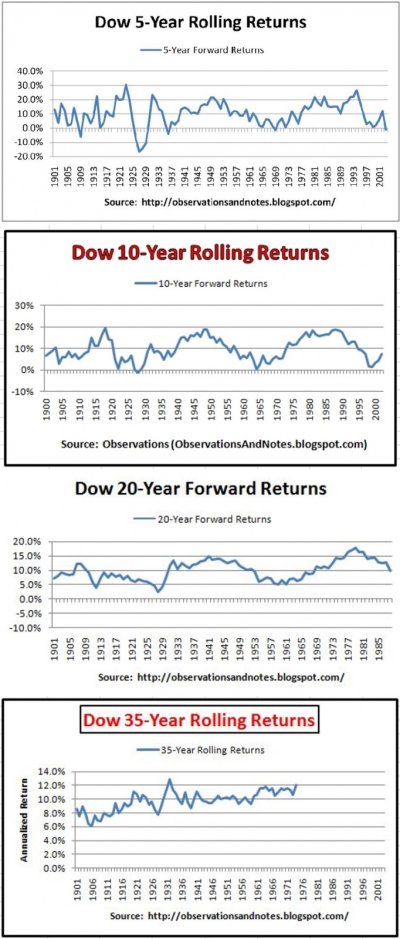
The graphs alone may answer your question...the magic of compounding over many years (more upside, less downside over time based on past history).
 

Attachments

  • Returns.jpg
    Returns.jpg
    312.5 KB · Views: 14
Last edited:
Back
Top Bottom