2018 YTD investment performance thread

YTD +.45%

The DOW numbers from Jan. 1st to March 30th 2018 are down about 600 points. So with a positive number on my investments I feel very good.
 
Q1 2018 investment returns

Time weighted return, including dividends, brokerage fees and margin interest.

And excluding any withdrawals or deposits to principal.

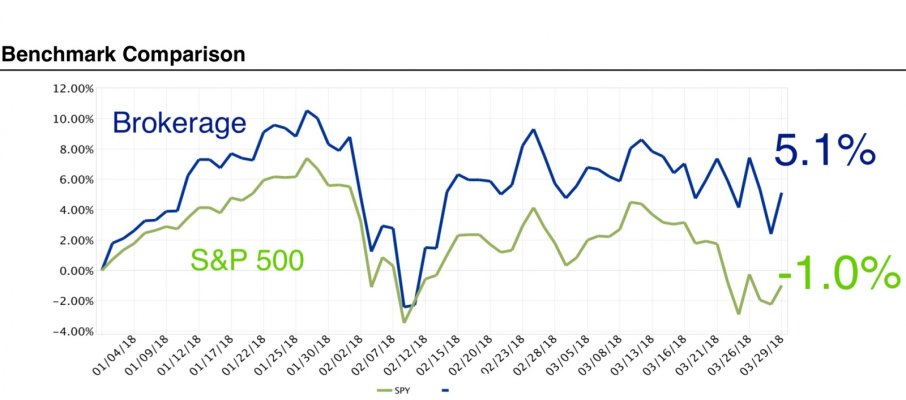
Q1 return was 5.1% compared to a -1.0% return for the S&P 500 benchmark.


So I handily beat the market, albeit with a high level of volatility over the quarter. I must admit it was emotionally a roller coast ride, some days I felt like a complete idiot, other days like the King Kong of Wall Street.


60BECD73-517B-4A72-AC3C-54B15F87DB50.jpg
 
Time weighted return, including dividends, brokerage fees and margin interest.

And excluding any withdrawals or deposits to principal.

Q1 return was 5.1% compared to a -1.0% return for the S&P 500 benchmark.


So I handily beat the market, albeit with a high level of volatility over the quarter. I must admit it was emotionally a roller coast ride, some days I felt like a complete idiot, other days like the King Kong of Wall Street.


View attachment 28159

WADR, if deposits or withdrawals are significant, then the returns are useless... like if you added $10k to a $1 million portfolio in early January then that 5.1% is more like 4.1%... and vice versa if you had significant withdrawals.
 
WADR, if deposits or withdrawals are significant, then the returns are useless... like if you added $10k to a $1 million portfolio in early January then that 5.1% is more like 4.1%... and vice versa if you had significant withdrawals.


Time weighted return is a very standard method of benchmarking investment performance and yes it specifically excludes withdrawals and deposits to the principal.

And since we are talking here about ‘investment performance’ and not ‘how big is my brokerage account’ , it is appropriate to use time weighted return.

The ‘how big is my brokerage account’ discussion would be another thread entirely.
 
Can you give me an example of how this "time weighted return" is calculated?

For example, if on Jan 1 the portfolio is $1 million and on Feb 1 $50k is added and on March 1 $5k is withdrawn and at Mar 31, the balance is $1,075k... what is the time-weighted return? (The XIRR is 12.49%).
 
Correction to my earlier post on S&P I earlier stated it was down -1.23%, but other sources state it is down -0.76%, I assume with Div based on SPY not the index.

I am more curious about real reports from those using a VG Boglehead 3 fund or 4 fund 60/40. My tracking shows these would have performed much worse. However Portfolio visualizer shows -0.7 and -0.75 % ytd, and SPY at -1.0%.

Somehow real numbers from actual portfolios differ, and I know this is one period where the Wells took a larger hit than most due to bond duration I assume.
 
Can you give me an example of how this "time weighted return" is calculated?

For example, if on Jan 1 the portfolio is $1 million and on Feb 1 $50k is added and on March 1 $5k is withdrawn and at Mar 31, the balance is $1,075k... what is the time-weighted return? (The XIRR is 12.49%).

Actually, I found this example on Investopedia:

Time-Weighted Rate of Return Calculation Examples
As noted, the time-weighted return eliminates the effects of portfolio cash flows on returns. To see this how it works, consider the following two investor scenarios:

Investor 1 invests $1 million into Mutual Fund A on December 31. On August 15 of the following year, his portfolio is valued at $1,162,484. At that point, he adds $100,000 to Mutual Fund A, bringing the total value to $1,262,484. By the end of the year, the portfolio has decreased in value to $1,192,328.

  • The holding-period return for the first period, from December 31 to August 15, would be calculated as:
  • Return = ($1,162,484 - $1,000,000) / $1,000,000 = 16.25%​
  • The holding-period return for the second period, from August 15 to December 31, would be calculated as:
  • Return = ($1,192,328 - ($1,162,484 + $100,000)) / ($1,162,484 + $100,000) = -5.56%​
  • The time-weighted return over the two time periods is calculated by geometrically linking these two returns:
  • Time-weighted return = (1 + 16.25%) x (1 + (-5.56%)) - 1 = 9.79%​
Investor 2 invests $1 million into Mutual Fund A on December 31. On August 15 of the following year, her portfolio is valued at $1,162,484. At that point, she withdraws $100,000 from Mutual Fund A, bringing the total value down to $1,062,484. By the end of the year the portfolio has decreased in value to $1,003,440.

  • The holding-period return for the first period, from December 31 to August 15, would be calculated as:
  • Return = ($1,162,484 - $1,000,000) / $1,000,000 = 16.25%​
  • The holding-period return for the second period, from August 15 to December 31, would be calculated as:
  • Return = ($1,003,440 - ($1,162,484 - $100,000)) / ($1,162,484 - $100,000) = -5.56%​
  • The time-weighted return over the two time periods is calculated by geometrically linking these two returns:
  • Time-weighted return = (1 + 16.25%) x (1 + (-5.56%)) - 1 = 9.79%​

Read more: Time-Weighted Rate of Return https://www.investopedia.com/terms/t/time-weightedror.asp#ixzz5BFKD0Vjb
Follow us: Investopedia on Facebook

But... if you XIRR the examples then the returns are different:

12/31/2017Beginning balance1,000,000.001,000,000.00
8/15/2018Addition100,000.00(100,000.00)
12/31/2018Ending balance(1,192,328.00)(1,003,440.00)
Return8.91%10.74%
 
YTD: -0.21% (after adjusting for spending)
AA: about 55/35/10 (cash includes CD's)

I'm not dancing, but I can live with this
 
-1.0% YTD, all-in, spend adjusted. REIT was most of the problem.
 
Last edited:
Actually, I found this example on Investopedia:

Investor 1 invests $1 million into Mutual Fund A on December 31. On August 15 of the following year, his portfolio is valued at $1,162,484. At that point, he adds $100,000 to Mutual Fund A, bringing the total value to $1,262,484. By the end of the year, the portfolio has decreased in value to $1,192,328.
...
Time-weighted return = (1 + 16.25%) x (1 + (-5.56%)) - 1 = 9.79%


Investor 2 invests $1 million into Mutual Fund A on December 31. On August 15 of the following year, her portfolio is valued at $1,162,484. At that point, she withdraws $100,000 from Mutual Fund A, bringing the total value down to $1,062,484. By the end of the year the portfolio has decreased in value to $1,003,440.
...
Time-weighted return = (1 + 16.25%) x (1 + (-5.56%)) - 1 = 9.79%

But... if you XIRR the examples then the returns are different:

12/31/2017Beginning balance1,000,000.001,000,000.00
8/15/2018Addition100,000.00(100,000.00)
12/31/2018Ending balance(1,192,328.00)(1,003,440.00)
Return8.91%10.74%


Yes, the TWR and IRR numbers can be different. Which is better? According to a Web site, the TWR is the better number.

See: Performance: Time Weighted Return vs. Internal Rate of Return | Merriman

The IRR, also commonly referred to as the dollar weighted return, is the measurement of a portfolio’s actual performance between two dates, including the effects from all cash inflows and outflows. Because cash flows are factored into the calculation, greater weighting is given to those time periods when more money is invested in the portfolio. By this definition, the IRR of a portfolio can be significantly affected by both the size and timing of any cash contributions or withdrawals.

The TWR captures the true investment performance by eliminating all the effects of capital additions and withdrawals from the portfolio. Simply stated, the TWR is the return on the very first dollar invested into the portfolio. This makes the TWR a more meaningful measurement of performance when used to analyze the underlying performance of the portfolio’s assets or comparing your investment manager performance to alternative investments.
 
NW-Bound >>>> thanks for those explanations of the two methods. So what method do you use IRR or TWR?

I use both because both ways tell me different data. I use the TWR for a month to month number but IRR method for the year end and for a check where I'm at on spending etc. I really never knew the methods by a name just by what each does for me.
 
I use the simple "Moneychimp" method that pb4uski shared on this thread: http://www.early-retirement.org/forums/f28/how-do-you-calculate-ytd-return-83399.html.

If one has no withdrawal nor new money, all these methods give the same number. In retirement, we only have withdrawals. And the lower the WR, the closer the 3 methods will converge.

My WR is roughly 2.5% last year. Out of curiosity, I will do all 3 methods for 2017 as I have full year data for it. I will report here later.
 
Thanks. I also use that one myself.
 
For the sake of investment performance accuracy, I tracked down my monthly expenses and portfolio values at each month end to compute investment return for 2017 using: 1) IRR (using XIRR function of OpenOffice), 2) TWR using month end balance, and 3) simple MoneyChimp method.

I ended up 2017 with 117.6245% of what I started. The return is actually quite higher than 17.6245%, because I withdrew 3.1376% of the starting value. The issue is that I withdrew throughout the year, and that same amount is 2.6674% of the ending value. OK, I remember it wrong when I said my WR was 2.5%. It was a bit higher than that.

So, the problem is how do I account for that WR? Enter the 3 methods above.

After entering all the info into the spreadsheet, I get the XIRR return of 21.060%, TWR of 21.082%, and MoneyChimp of 21.093%.

As suspected, the difference is down to a few hundredths of 1%. In dollar amounts, that's equivalent to $100-$300 for each $1,000,000 in a portfolio. I say that's down in the noise.

I looked back at the 2017 YTD thread. There, I reported 21.1% after rounding.

Hope this helps.

PS. For me, the 3 methods agree reasonably well because my WR is small, and spread out fairly evenly throughout the year. If you take a large lump sum at the beginning or end of the year, that may skew the results significantly between the methods.
 
Last edited:
That makes sense to me and that is what I do also. Thanks for sharing that and explanation.
 
FIDO indicates up 1.73% for the quarter on my 401k. whoopee.

401k AA is currently 100/0/0 because I am figuring cash balance pension is de facto bond fund. With that thought, AA is about 75/25/0.

Pension is up 1% for the quarter.

57 and still accumulating.

Looking forward to becoming self-unemployed.
 
Correction to my earlier post on S&P I earlier stated it was down -1.23%, but other sources state it is down -0.76%, I assume with Div based on SPY not the index.

I am more curious about real reports from those using a VG Boglehead 3 fund or 4 fund 60/40. My tracking shows these would have performed much worse. However Portfolio visualizer shows -0.7 and -0.75 % ytd, and SPY at -1.0%.

Somehow real numbers from actual portfolios differ, and I know this is one period where the Wells took a larger hit than most due to bond duration I assume.
I gave examples of such single-fund portfolios: http://www.early-retirement.org/for...t-performance-thread-90118-9.html#post2031783

My portfolio is a heavily small-cap and value tilted portfolio and it outperformed all the funds that I listed except one of them. It should have done worse since small-cap value index fund VSIAX [which is not listed in my link] performance was -2.07% YTD and is one of my substantial holdings.
 
Last edited:
Correction to my earlier post on S&P I earlier stated it was down -1.23%, but other sources state it is down -0.76%, I assume with Div based on SPY not the index...
Yes.

The trailing dividend yield of the S&P is 1.8% per annum.

The difference between -1.23% and -0.76% is 0.47%, which is about right for one quarter's worth of dividends.
 
Back
Top Bottom