In my OP I said I was an amateur investor. Why attack me?
If I may refresh your memory, what you actually said in your OP was
I used my dad's cronies to get an investment banking position at a Goldman Sachs subsidiary in LA.
In my OP I said I was an amateur investor. Why attack me?
I used my dad's cronies to get an investment banking position at a Goldman Sachs subsidiary in LA.
It is an ETF that tracks an index, of course. Not all ETFs are index funds; some are actively managed, a fact that many people are not aware of.I know what an ETF is, what an index is, what a fund is.
What exactly is an ETF index fund?
It is an ETF that tracks an index, of course. Not all ETFs are index funds; some are actively managed, a fact that many people are not aware of.
The market goes up, the market goes down.Gonna get me flamed, but I see a reversion to the mean within months that will make 2008 look like a good year.
I don't claim amazing math skills, nor clairvoyance, but this simple look should cause caution, no, no panic.
Go to market watch.com and select advanced chart.
Plot 5 years of Dow, then plot 10 years and then plot All Data. First two are not scary, third is terrifying, at least to me. Does anyone believe the market will continue the growth that the 2008-2018 timeframe shows?
Do your own assessment, but note that if you use a ruler and do: dbl tops/dbl bottoms, things are deceiving, if you look at the actual curve in Excel, do you think a large reversion is coming. It is unsustainable in my amatuer opinion.
Would love to hear opinions, especially countering views and reasoning.
Hoping this is considered as a "time to think it anew".
Too subtle for me anyway.Obviously, I was too subtle.
The F in ETF stands for Fund. An ETF Fund is a redundancy. ...

I know what an ETF is, what an index is, what a fund is.
What exactly is an ETF index fund?
If I may refresh your memory, what you actually said in your OP was
I know what an ETF is, what an index is, what a fund is.
What exactly is an ETF index fund?
Are you serious or just having a covert harassment of me?
I can't get away from the possibility that I am a chartist. I like charts!
I can't get away from the possibility that I am a chartist. I like charts!
Interesting percentages. Shows that the international markets weren't safe, and the smallest losses were in the S&P.Now is the time to adjust your exposure so you can stomach a real bear. If there's a chance you'll bail before the recovery or won't live long enough for the recovery, correct your allocation "permanently".
... Does anyone believe the market will continue the growth that the 2008-2018 timeframe shows? ...
Would love to hear opinions, especially countering views and reasoning.
Hoping this is considered as a "time to think it anew".
...Sort of like when you get cash from an ATM machine.
Obviously, I was too subtle.
The F in ETF stands for Fund. An ETF Fund is a redundancy.
I tried to make that clear with my reference to an ATM machine. The M in ATM stands for Machine.
Too subtle for me anyway.

A try at explaining my post.
CHART
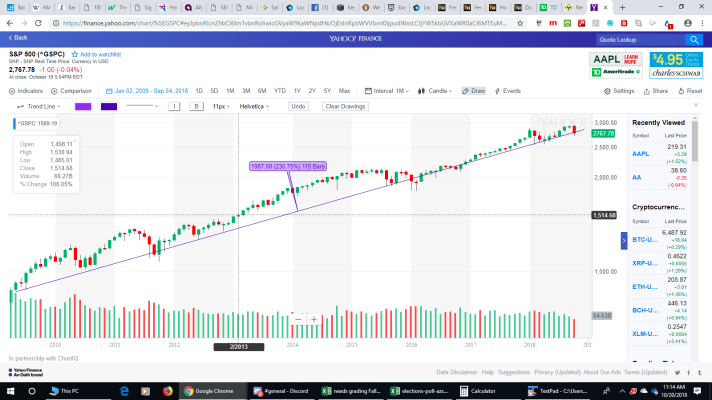
Get a ruler or just eyeball. From 2009 to 2016 (8 years) the market increased from 6,500 to 16,500 or 10,000 points increase, close to historical winner. Now eyeball 2017 to 2018, it went from 16,500 to 26,000 or 10,000 point increase.
So it took 8 years, now it is taking 2 years, hard to believe it will continue that trend.
Now if you are curious, print that chart and leave room on the right side. Draw a line thru the mean of the 2009-2016 data and extend it out, then do the same for 2017-2018. Call them line A and line B.
My prediction is the market will drop in the first quarter from line A to line B. That is, reversion to the mean at its best.
Put your predictions out and mid 2019 lets have a thread where we admit we were wrong, just for fun.
My financial is 40%ish venture capital, 40%ish private equity and 20%ish ETFs. Sort of Warren Buffety, own what you know.
Please provide a comprehensive list of your predictions over the past ten or twenty years and how they turned out.... My prediction is the market will drop in the first quarter from line A to line B. ...
A try at explaining my post.
CHART
Get a ruler or just eyeball. From 2009 to 2016 (8 years) the market increased from 6,500 to 16,500 or 10,000 points increase, close to historical winner. Now eyeball 2017 to 2018, it went from 16,500 to 26,000 or 10,000 point increase.
So it took 8 years, now it is taking 2 years, hard to believe it will continue that trend.
Now if you are curious, print that chart and leave room on the right side. Draw a line thru the mean of the 2009-2016 data and extend it out, then do the same for 2017-2018. Call them line A and line B.
My prediction is the market will drop in the first quarter from line A to line B. That is, reversion to the mean at its best. ....
... As an aside, points are meaningless, it is the rate of change that has meaning. Here's an alternative picture, log scale with a trend line included:
... Put your predictions out and mid 2019 lets have a thread where we admit we were wrong, just for fun. ....
Exactly, my prediction is 46% in February. But you prediction is more plausible than mine.See my note on "points" below, but how 'bout you give us specific numbers for your prediction, rather than asking us to draw the lines? If I take numeric averages, it looks like you are predicting a 46% drop in Q1 2019? If it happens this quarter, are you 'wrong'?
It's possible. I just don't see enough evidence to act on it, and if there were that much evidence, I suspect it would have already made most of that drop, making the whole act of 'predicting' pretty meaningless.
Maybe I missed it, do you have an action plan? Did I see that you aren't doing anything now, you will wait till we are closer to Q1 2019?
It's hardly an 'aside' it is fundamental to any analysis. The earlier period was a ~154% gain, the later period, a ~ 58% gain.
OK, and my prediction will be correct.
The market, in 2019, will go up, go down, or maybe stay the same. And that is what I will 'act' upon (if taking no action can be considered an act).
-ERD50
OK, and my prediction will be correct.
The market, in 2019, will go up, go down, or maybe stay the same. And that is what I will 'act' upon (if taking no action can be considered an act).
-ERD50