Asset Allocation and Impact on Retirement Investment

I know of several colleagues who got hammered on a downturn. 30-50 percent declines on their equity holdings.

They got nervous, bailed, and went with fixed. The missed the subsequent upturn. It cost them several years of early retirement.
 
I'm curious to hear what financial advisors are telling clients are an acceptable success rate on either back-testing or monte carlo simulations? 90%? 95% 80%?

I personally shoot for 95%, but I've been told some financial advisors are happy with 80%+. That seems aggressive to me. There's a 20% chance of running out of money? That would suck.

Great question on the Monte Carlo simulations probability of success percentage. Curious to know as well.

In this video below (3:50 minutes in video), the financial advisor is using RightCapital and this is how he is interpreting the Monte Carlo simulation probability of success percentage:

90-100% - You might want to spend more money in retirement.
80-90% - You are really good
70-80% - You are still good
Low 70, High 60 - You need to monitor the plan

 
Last edited:
I didn't look at the others, but the blue curve for Portfolio 1 is just wrong. US large cap did not decline from 2000 to 2023. In 2000 the S&P 500 peaked around 1520 and now it is around 4450, and that does not include dividends.
 
I love this video illustrating how Asset Allocation can impact the success of your retirement.

In summary, the video illustrates how a 80/20 and 60/40 portfolio outperforms a 100% equity portfolio over a 23 year period from 2000-2023 based on the following assumptions:

- $2M Initial Amount
- $80K Fixed Withdrawal Amount

Below is a screenshot of the percentages used in each Asset Class.

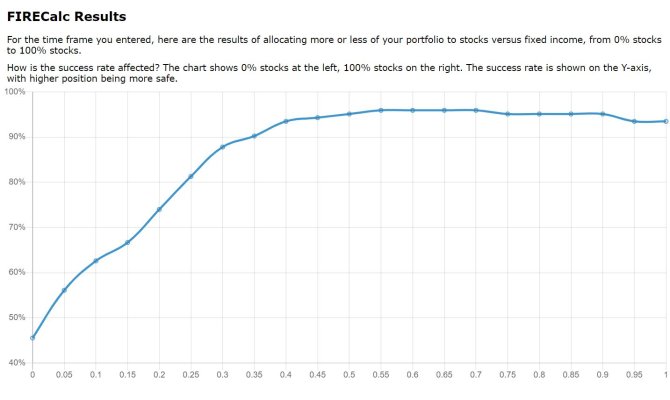
No surprise there. FIRECalc indicates that 80/20 or 60/40 have higher success rates than 100/0.
 

Attachments

  • Capture.JPG
    Capture.JPG
    101.5 KB · Views: 47
I'm curious to hear what financial advisors are telling clients are an acceptable success rate on either back-testing or monte carlo simulations? 90%? 95% 80%?

I personally shoot for 95%, but I've been told some financial advisors are happy with 80%+. That seems aggressive to me. There's a 20% chance of running out of money? That would suck.


In most cases, "failure" doesn't mean running out of money. Few retirees charge ahead with spending if they see that the "plan" is falling apart. Instead, they modify their spending (My BFF not withstanding.) I have several built in back-ups "just in case" even though I always have gotten 100% on FIRECalc. YMMV
 
Last edited:
... There's a 20% chance of running out of money? That would suck.
None of these calculators is, or can be, predictive. What the 20% means is that over some past historical period, 20% of the modeled portfolios failed. We'll find out what the future brings as we experience it. That's the only way. To think that it will be identical to some period of past history is certain to be wrong.

IMO models that spit out numbers like this are deliberately encouraging users to misinterpret them. I think that three options, something like "looks ok," "on the fence," and "doesn't look too good" as outputs would be much less misleading.
 
I didn't look at the others, but the blue curve for Portfolio 1 is just wrong. US large cap did not decline from 2000 to 2023. In 2000 the S&P 500 peaked around 1520 and now it is around 4450, and that does not include dividends.

You may have missed that there were withdrawals. They were withdrawing 4% of the initial pot each year. Of course, this exposed them to the SORR of the dotbomb/Sept. 11 crash and the GFC.
 
None of these calculators is, or can be, predictive. What the 20% means is that over some past historical period, 20% of the modeled portfolios failed. We'll find out what the future brings as we experience it. That's the only way. To think that it will be identical to some period of past history is certain to be wrong.

IMO models that spit out numbers like this are deliberately encouraging users to misinterpret them. I think that three options, something like "looks ok," "on the fence," and "doesn't look too good" as outputs would be much less misleading.

Ha, I just posted something very similar in another thread. I found looking at Historical data is dangerous. Portfolio Visualizer allows you to plug in different views of the future: historical, forecasted returns, statistical, etc. It's really all about what assumptions you believe the future brings.

I just don't see how financial advisors should be advocating a portfolio withdrawal strategy that has a 20% or 30% chance of failure. Some people can't cut back on spending enough to offset the performance declines. And, when does a person realize they are in trouble and start pulling back spending, if they can? 2 years? 3? 5? 10? Earlyretirement now did some analysis that basically showed for some scenarios one might encounter, it would be extremely difficult to pull back on spending enough to get "right" again for the future.
 
... I just don't see how financial advisors should be advocating a portfolio withdrawal strategy that has a 20% or 30% chance of failure. ...
WADR I think you're missing the point. Since no one knows the future, no one can give you any kind of probabalistic numbers about it. Sure, you can go with gut feel, which is basically what inductive reasoning is, but to put numbers on the future is just not possible. Extending the point, to be concerned about the differences between 90% and 100% is to not understand the limitations of the calculator.

From https://firecalc.com/ :"How can FIRECalc predict future returns from past performance? It can't."
 
That kind of a survey is more like the right way to go about it. This video's asset allocations appear to be very carefully tuned to +/- 1% values, leading me to be more suspicious that just my general distrust of backtests.

The data presentation appears to come from Portfolio Visualizer (https://www.portfoliovisualizer.com/)

I understand your frustration with back-testing.

Heh, heh, be the first one on your block to design your own forward-looking test on asset allocation. In 20 years, get back to us on the results - I'll be gone, but some of us here will be very interested in the results. Of course - even that won't be predictive of future results. Funny how that w*rks.:cool:

IOW Backtesting is what we have. It's far from perfect but better than nothing. It's not specifically predictive of the future but it does allow the use of virtually all the data that's ever been generated. With that, such things as FIRECalc can be created. Again, not perfect and not strictly predictive - but at least it gives an idea of the range of the parameters - assuming a mile wide rock doesn't land in the Atlantic. YMMV
 
Last edited:
historical data is much more likely to be accurate than monte carlo analysis which generates huge tails that have never occurred in real life.
 
...- assuming a mile wide rock doesn't land in the Atlantic. YMMV

Speaking of which, go here https://neal.fun/asteroid-launcher/ and launch a 1 mile wide asteroid in the middle of the Atlantic.
tsunami.svg

The impact will create a 1.1 mile tall tsunami

speed.svg

Your asteroid impacted the water at 37,948 mph
explosion.svg

The impact is equivalent to 355 Gigatons of TNT


peak wind speed 16,605 mph


... IOW Backtesting is what we have. It's far from perfect but better than nothing. It's not specifically predictive of the future but it does allow the use of virtually all the data that's ever been generated. With that, such things as FIRECalc can be created. Again, not perfect and not strictly predictive - but at least it gives an idea of the range of the parameters - assuming a mile wide rock doesn't land in the Atlantic. YMMV
The D-Day weather problem: ... a story possibly apocryphal but worthwhile anyway: One day well prior to D-day, the army Met (meteorological) office received a request from SHAEF for a weather forecast on a specific day a couple of months in the future. "Impossible," they said and this was relayed up the chain of command. Back down came the order: "A forecast is required for planning purposes."

I don't argue that backtesting is completely useless. I use Portfolio Visualizer once in a while to compare portfolios, looking mostly at the degree of correlation. The problem with backtesting gadgets is that people do look at them as being predictive. That is why we see, in thread after thread, people concerned about the difference between 90% and 100%.
 
Last edited:
historical data is much more likely to be accurate than monte carlo analysis which generates huge tails that have never occurred in real life.
Not sure I get your point. Historical data has fat tails. Since standard deviation applies only to Gaussian distributions, we get breathless reporting of "100 year" market declines. Same-o for weather data which is also not Gaussian; we get "100 year" events all the time. Fat tails.
 
Complaining

OMG,
I think most of ya”ll love complaining & also, love getting off topic to further your complaining. My take on the video was don’t put all your eggs in ONE BASKET, Asset Allocation is important. That was what’s the video point was explaining in my view. From there you decide what you do with your assets.
 
The D-Day weather problem: ... a story possibly apocryphal but worthwhile anyway: One day well prior to D-day, the army Met (meteorological) office received a request from SHAEF for a weather forecast on a specific day a couple of months in the future. "Impossible," they said and this was relayed up the chain of command. Back down came the order: "A forecast is required for planning purposes."

I don't argue that backtesting is completely useless. I use Portfolio Visualizer once in a while to compare portfolios, looking mostly at the degree of correlation. The problem with backtesting gadgets is that people do look at them as being predictive. That is why we see, in thread after thread, people concerned about the difference between 90% and 100%.


Yeah, it's not so much the back testing algorithm that's at fault - but the use of the results. Like getting 97% and then doing OMY until 100% pops up on the "gadget." I'd like to think no one here has done that with FIRECalc.:(

Heh, heh, as usual, see my tag line.:cool:
 
Speaking of which, go here https://neal.fun/asteroid-launcher/ and launch a 1 mile wide asteroid in the middle of the Atlantic.
tsunami.svg

The impact will create a 1.1 mile tall tsunami

speed.svg

Your asteroid impacted the water at 37,948 mph
explosion.svg

The impact is equivalent to 355 Gigatons of TNT


peak wind speed 16,605 mph


Thanks. Very cool site. Heh, heh, take THAT Omaha!

I actually worry (well, occasionally think about) a Nuke from N. Korea. I wonder if there is a similar site for that? We had the false alarm a few years back and a lot of people really freaked - we didn't. I've heard that there are ways to survive such an attack at least at certain distances. So I guess I'm curious.

I found at least one site with "helpful hints" on survival (and, of course, sales of equipment to assist in your survival.) Do I really want a mask and a suit on my limited shelves? (I'm sure I would if Pearl were ever attacked - again.) YMMV
 
...

I actually worry (well, occasionally think about) a Nuke from N. Korea. I wonder if there is a similar site for that? We had the false alarm a few years back and a lot of people really freaked - we didn't. I've heard that there are ways to survive such an attack at least at certain distances. So I guess I'm curious.
...

https://nuclearsecrecy.com/nukemap/

It even has presets for the NorKs.
 
From asset allocation to asteroids, fireballs and nuclear devices in just a few posts. I don’t recall seeing such dramatic thread drift.

Adding to it, you all know that after the nuclear devastation the cockroaches will reign supreme.
 
Adding to it, you all know that after the nuclear devastation the cockroaches will reign supreme.

As a schoolchild in NYC, we were taught to survive a nuclear holocaust by getting under our desks. Practiced several times a year.
 
Great question on the Monte Carlo simulations probability of success percentage. Curious to know as well.

In this video below (3:50 minutes in video), the financial advisor is using RightCapital and this is how he is interpreting the Monte Carlo simulation probability of success percentage:

90-100% - You might want to spend more money in retirement.
80-90% - You are really good
70-80% - You are still good
Low 70, High 60 - You need to monitor the plan


This makes sense to me and I imagine that most retirees would love an 80% chance of success and would be able to adjust spending accordingly to move that probability higher.

As opposed to some who pad their projected expenses 200%, don't include social security, and still want 100% success. :facepalm:

Curious to hear from others as well.
 
Back
Top Bottom