So I want to do some simple side by side annual comparisons of individual ET/Fund performance and it seems like every source I look at has different calculations for "Total Return". Example: I was looking up YTD Total Return for PGX... Bloomberg says 1.01%, Schwab says 1.22%, and Yahoo says -1.9%. I like how Yahoo provides a year by year historical return, which is what I am ideally looking for, but can I trust the numbers? Is there a reliable source out there to extract this info? You would think it would be a simple math equation which would produce consistent numbers, but apparently not.
You are using an out of date browser. It may not display this or other websites correctly.
You should upgrade or use an alternative browser.
You should upgrade or use an alternative browser.
Best Source for Accurate Annual Historical ETF/Fund Returns?
- Thread starter DawgMan
- Start date
the 1.01% is day end; the 1.22% is month end.
the 1.01% is day end; the 1.22% is month end.
Good catch, however, if I dig further into Yahoo's numbers it appears they are saying the return was -3.34% YTD (end of month). It still begs the question what site out there is reliable?
I always use Morningstar.
I always use Morningstar.
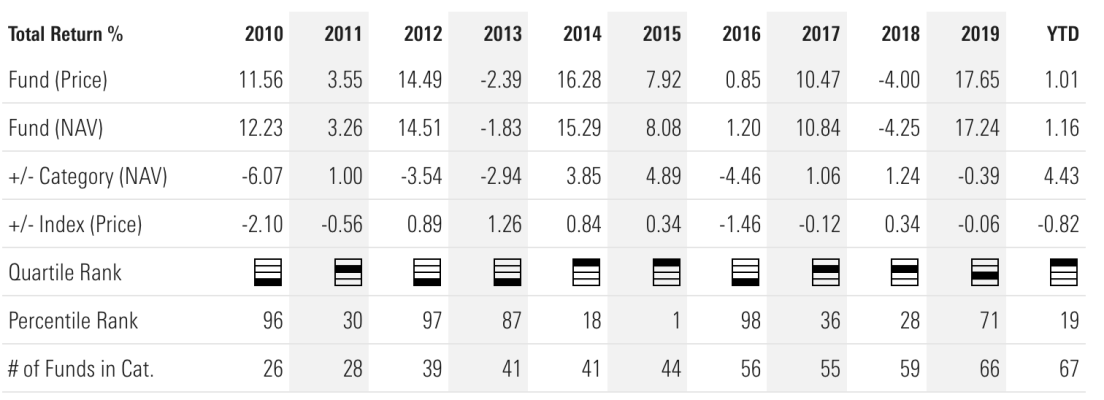
Thanks. I looked on Morningstar, but did not see where they provide a historical annual (by year) total return which is ideally what I was looking for. To my earlier point, comparing Yahoo, https://finance.yahoo.com/quote/PGX/performance?p=PGX , to a site called ETFrepaly, https://www.etfreplay.com/etf/pgx.aspx , you can see they both provide what I am looking for, but different values?? Shouldn't this be consistent as it is based on a basic mathematical equation?? While these 2 sites are close, some years are off by as much as 1% in total return. Is there a way to get Morningstar to show by year?
I guess I don't understand. The M* page looks to me like it gives that.
https://www.morningstar.com/etfs/arcx/pgx/performance

https://www.morningstar.com/etfs/arcx/pgx/performance

target2019
Give me a museum and I'll fill it. (Picasso) Give me a forum ...
The only way to know for sure is to download historical price and dividend data. Then determine if Yahoo reinvests dividends, and make a calculation of YTD performance.
I hold PGX, but never had much interest in YTD for one holding. I see why accuracy is important for your needs.
I hold PGX, but never had much interest in YTD for one holding. I see why accuracy is important for your needs.
I guess I don't understand. The M* page looks to me like it gives that.
https://www.morningstar.com/etfs/arcx/pgx/performance
View attachment 35896
I stand corrected, not sure how I missed that. And I also now see where the values are off. It appears one site is calculating total return on price and the other NAV. Confusing, none the less.
Thanks.
The only way to know for sure is to download historical price and dividend data. Then determine if Yahoo reinvests dividends, and make a calculation of YTD performance.
I hold PGX, but never had much interest in YTD for one holding. I see why accuracy is important for your needs.
I have held an allocation of PGX in my fixed allocation during accumulation and still plan keeping some once I start withdrawals. I am transitioning to withdrawal mode now and plan on implementing a "bucket overlay" on my AA so as I assign certain ETFs/funds to my buckets based on certain risk profiles, I wanted to do an historical year by year performance comparison of my fixed holdings next to my equity allocations to see their respective returns/volatility to help further define how I want to stack my fixed bucket (up to 10 yrs of spending). Just 1 more check & balance to get the warm fuzzes on my holdings.
target2019
Give me a museum and I'll fill it. (Picasso) Give me a forum ...
Yahoo historical has dividend data to help you with that income estimate month by month.I have held an allocation of PGX in my fixed allocation during accumulation and still plan keeping some once I start withdrawals. I am transitioning to withdrawal mode now and plan on implementing a "bucket overlay" on my AA so as I assign certain ETFs/funds to my buckets based on certain risk profiles, I wanted to do an historical year by year performance comparison of my fixed holdings next to my equity allocations to see their respective returns/volatility to help further define how I want to stack my fixed bucket (up to 10 yrs of spending). Just 1 more check & balance to get the warm fuzzes on my holdings.
I could kick myself for not watching more closely in March. I could have added PGX at a significant discount.
pb4uski
Give me a museum and I'll fill it. (Picasso) Give me a forum ...
So I want to do some simple side by side annual comparisons of individual ET/Fund performance and it seems like every source I look at has different calculations for "Total Return". Example: I was looking up YTD Total Return for PGX... Bloomberg says 1.01%, Schwab says 1.22%, and Yahoo says -1.9%. I like how Yahoo provides a year by year historical return, which is what I am ideally looking for, but can I trust the numbers? Is there a reliable source out there to extract this info? You would think it would be a simple math equation which would produce consistent numbers, but apparently not.
I like Portfolio Visualizer.
https://www.portfoliovisualizer.com/backtest-portfolio#analysisResults
Looks like a great tool, thanks!
Similar threads
- Replies
- 24
- Views
- 2K
- Replies
- 16
- Views
- 567
- Replies
- 144
- Views
- 9K
