I think the basic premise is that the market can be irrational for periods of time. If you are withdrawing money during an extended period of negatively, you may be "locking in" that negatively. In March of this year my portfolio was down close to 1/3rd of it's value, but my dividend income saw hardly a blip. If the market would not have recovered so quickly, there could have been a real negative impact of selling those deflated securities. ...
Go back and re-read my post. This is simply not a valid concern, it doesn't work that way with a 70/30 blend. You just would not sell stocks in a down market, that's what the bonds do for you. And they do it better than div payers.
... It's in the spending period where I think you could encounter scenarios (e.g. retiring at the beginning of a recession) where the Dividend strategy is less risky. ...
Again, do you have any data to back that up? I'm all eyes/ears, but I respond to data/facts, not statements presented with no backing.
... I also don't think the future is going to be as rosy as the past - with interest rates approaching 0% I'm not comfortable holding any material value in bonds. ... .
Well, no one has a crystal ball. And we've seen some highly regarded Blue Chip stocks that were long considered "forever" stocks lose a lot of value or go away entirely. That's why I like diversification. It's worked comparatively well over quite a few scenarios, no reason to think it won't work well in the future.
... Also, a huge part of why your strategy beats the Dividend Growth strategy is investments like Tesla - I point to the dot com bubble to say the market can be irrational on the upside as well. ...
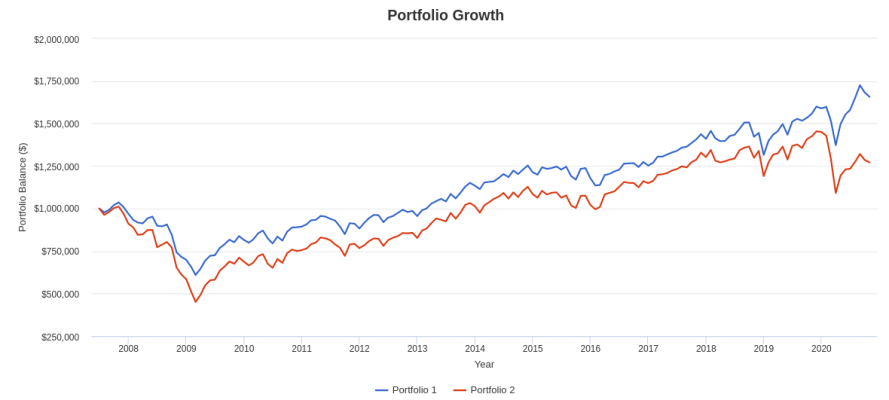
No, it's because it is diversified, and holds a wide range of stocks. And it is simply not true that the div payers hold up better in a downturn. Look again at this the 70/30 index vs the 7 div paying funds. You'll see
the div payer portfolio dropped more than the 70/30 blend in both the 2008-2009 drop, and the early 2020 drop, while providing the same $35,000 income. The difference is, it is
the div payers that don't recover as well.
https://bit.ly/3l2fMrP
... Finally, it simplify's the math. If I make $100 in income and spend $90, I don't need to spend a lot of time running Monte Carlo Simulations to see if I'm going to run out of money.
I don't use and don't believe in Monte Carlo simulations for this sort of financial analysis (they can be useful for engineering analysis). The charts I provided were
actual historical results.
And history says, and I showed it to you, that I can W/D
much more from a 70/30 index than you can from a div paying sector, and I still have more money than you.
I simply cannot understand why these div payers are so attractive to some people, after they have seen this evidence. And when will the div paying fans ever present
evidence?
Here's the pic for those not following the link. The Blue line (port#1) is 70/30 Stock/Bond Index, the lagging Red line (Port#2) is 7 div paying funds equally weighted.
FVD
VIG
SDY
IDV
DTD
VYM
DVY
Yeah, yeah, yeah, I know. You wouldn't hold the stocks in those funds, you have better ones. Well, anyone can play that game, I could cherry pick some growth stocks that would blow the index away. But I can't rely on that going forward.
You could start a new thread with your div paying picks and weighting, and update it when/if you change allocation. It would be pretty easy to enter them in that web page and test them as we go, matching the annual divs to W/D from the index blend.
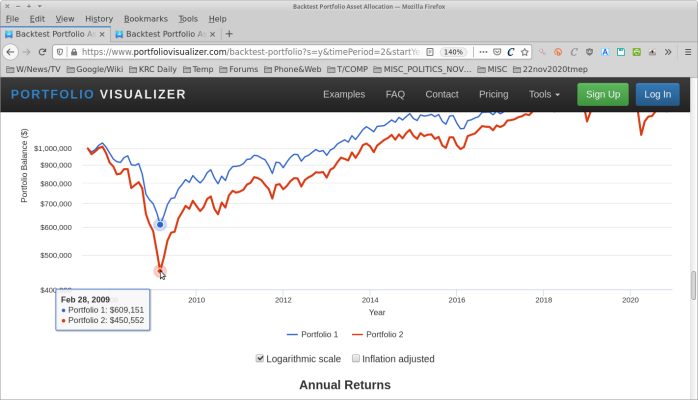
And a pic with the 2009 drop highlighted, that's an unsettling difference in portfolio value, $609K for the index, and $450K for the div payers? Yikes!
-ERD50
 Yet, people focused on the tax deduction rather than the total amount of interest paid.