jazz4cash
Give me a museum and I'll fill it. (Picasso) Give me a forum ...
I haven't seen this posted. Mods feel free to delete if this is a duplicate.
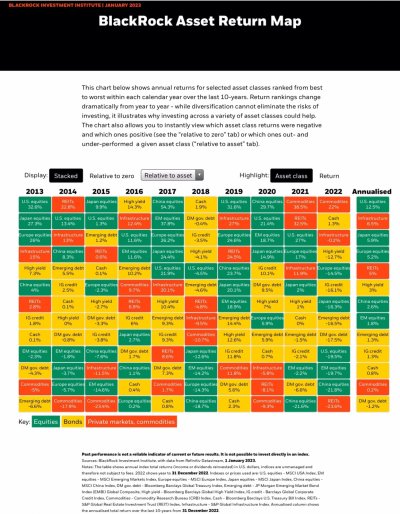
The Callan Periodic Table of Investment Returns shows annual investment returns by asset class. It is generally used to demonstrate the value of diversification. In case anyone was asleep at the wheel, it was a rough year.
The Callan Periodic Table of Investment Returns shows annual investment returns by asset class. It is generally used to demonstrate the value of diversification. In case anyone was asleep at the wheel, it was a rough year.
 Thanks from me, too. I LOVE good graphical displays that help you understand a complicated set of numbers and this is one of the best. It really shows why you shouldn't chase the latest hot category or dump everything in one that's out of favor.