First off, I'm not recommending dollar cost averaging to anyone and secondly, I am a disciple of Bob Brinker's Marketimer strategies. This is just for those who are unsure or don't know much about what it is. It is basically a hedging strategy of investment to smooth out variance during a desired period of time. Please do not consider this advice, a tout or solicitation.
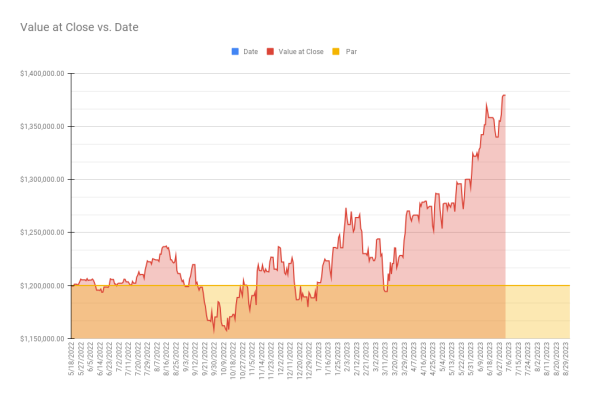
That said in May 2022 I had $1.2M in cash that I wanted to move into SPY (in my case I chose VFIAX (Vanguard's version of SPY). I setup automatic purchases at Vanguard of $100K/month for 12 months. The result was as expected but the graph shows the power of smoothing with a significant dip in Sept 2022 but a nice recovery moving forward. The net position took multiple dips into the loss column as the S&P oscillated during that time. These results also include quarterly dividend reinvestment. Additionally, had I just bought 100% in May 2022 it would have yielded approximately the same amount with dividend reinvestment but at greater risk if the market would have tanked during that time. Just be aware that this is a smoothing strategy and really designed for the investor not to "get unlucky" with timing.
Please do not take this as advice and this is just for informational purposes. Past performance is not an indication of future performance, etc. There are countless strategies for introducing cash into an investment portfolio and this is just one of them.
Relevant dates (sorry for the eye test):
Date Transaction Holding Price Total Value Fund MM Cash Value at Close Par Profit/Loss Pct Gain/Loss
5/18/2023 3342.940 $388.11 $1,297,428.44 $0.00 $1,297,428.44 $1,200,000.00 $97,428.44 8.12%
7/3/2023 3356.007 $411.06 $1,379,520.24 $0.00 $1,379,520.24 $1,200,000.00 $179,520.24 14.96%
Key numbers are on
5/18/2023 (one year later) gain $97.4K 8.12%
7/3/2023 (last check-in) gain $179.5K 14.96%