"I lost $25K today"--Does it really feel like that?

The recent market gyrations have been nerve racking for most including myself. I haven't sold anything, but actually bought AAPl at 108.00 on monday.

In an effort to compare my investment results with that of the market i compared the returns for the period 6/30/2015 (last brokerage statement) to last night's balance. I noticed that from 06/30/2015 THRU 08/25/2015 S&P-500 dropped 9.50% and my all stock portfolio with 6% cash reserves dropped 7.78%. Perhaps dividend income had something to do with my portfolio doing a little better than S&P-500! That made me feel reassured that my asset allocation and investment strategy is working and I will stay the course instead of trying to time the market.
Thanks.
 
To me a loss is compared to what I paid for something, not compared to some recent peak valuation.

True. Despite the recent haircut, my Quicken screen shows I still have several times that in unrealized gain. And I only started to track returns in Quicken for the last 5 years.

But, but, but when that gain is depleting, that brings to my mind the possibility that the SWR that I thought was safe may not have as much margin as thought. We need to be reminded every so often that the range of outcome is huge for a fixed WR as shown by FIRECalc. The more the market goes down, the more it looks like our future may, just may, resemble the FIRECalc line that looks like the trajectory of a sea-skimming Exocet than that of a shuttle take-off. :D

No, we are not there yet. Not with a measly 10% correction. But I like to know what's going on, and "See no evil, hear no evil, talk no evil" is not my style.
 
Last edited:
After yesterday, I was kind of tempted to start a new thread named: "I just made 50k today -- How should I feel?" or something like that.

But, I didn't want to be a wise guy.:angel:
 
You should feel generous. I'll send you my address.
 
I do not know if it is just me, but I have noticed long ago right after I started to track my stash daily that the worst down days are of higher magnitude than the best up days. And that is the same with the indices. The ratio is about 1.5x to 2x. Longer term, the market tends to go up slowly, then crashes hard. The chart looks like a saw-tooth wave (EEs know what I am talking about here), but with asymmetrical slopes up and down.

That corroborates what we have also read elsewhere, that the pain of losing feels stronger than the pleasure of winning.

In succinct form, Fear > Greed in most people.

To win in the market, perhaps all one needs to do is to have "Greed = Fear", and learn to be greedy and fearful in the contrarian manner like Buffett said.
 
Last edited:
Absolutely a saw tooth curve. Quick discharge on the capacitor, and slow charge back. :)
 
So what is the time constant here then? tau = RC but what value is R?
 
Very good. I was certain that many posters could relate to this sawtooth waveform. And in case you want to refresh some materials in that college class in the distant past - I don't know why you ERs would, but just in case - here's a youtube video on the analysis of this simple waveform.


The stock chart looks superficially like that. Observe that the ramp up is much slower than the quick skid down: the S&P just lost 18 months of gain in a matter of a week. In the past it has lost many years of gain in a matter of a few months. That's where the similarity with the sawtooth wave lies. Energy builds up slowly, then gets discharged very fast. And yes, same as with a capacitor discharge, there are sparks, accompanied by shocks and loud verbal curses. A difference with the sawtooth wave is that near the stock price crest, if one pays attention, he will discern many "Wheee" signals. It may be a distinct "Wheee" post, or it may be more subtle in the form of many posts in the "New Milestone" thread.

But the stock chart time scale is not constant. Is the market god tricky, or the investor sentiment very unstable, and border on the schizophrenic? The stock chart does not repeat, it only rhymes with itself.

So, what practical use comes out of this analogy? In real life, things cannot be so simple, else we would all be rich (Why not, some ask, but that's another subject and let me just say that some will have to work or society would fall apart). The stock price chart cannot have a definitive period, nor amplitude.

How do we use this analogy to the idealistic simpleton sawtooth waveform then, you ask? No, it does not lend itself to a direct and simple application. But observing that the ramp up tends to be slow will let us be patient in getting back in to the market after a crash. It is not going to run away from us and set a new high as quickly as it crashes.

Patient, patient... I am keeping my powder dry and continue to watch for a while. It takes time for that voltage to build up. I don't think I will be missing the boat.
 
Last edited:
I gain or lose large amounts on a regular basis. I like to say " I made $xxx,xxx today but I 've made this same money many times before". It's really only new highs that get me thinking. New lows would also be an issue but highly unlikely.
 
Last edited:
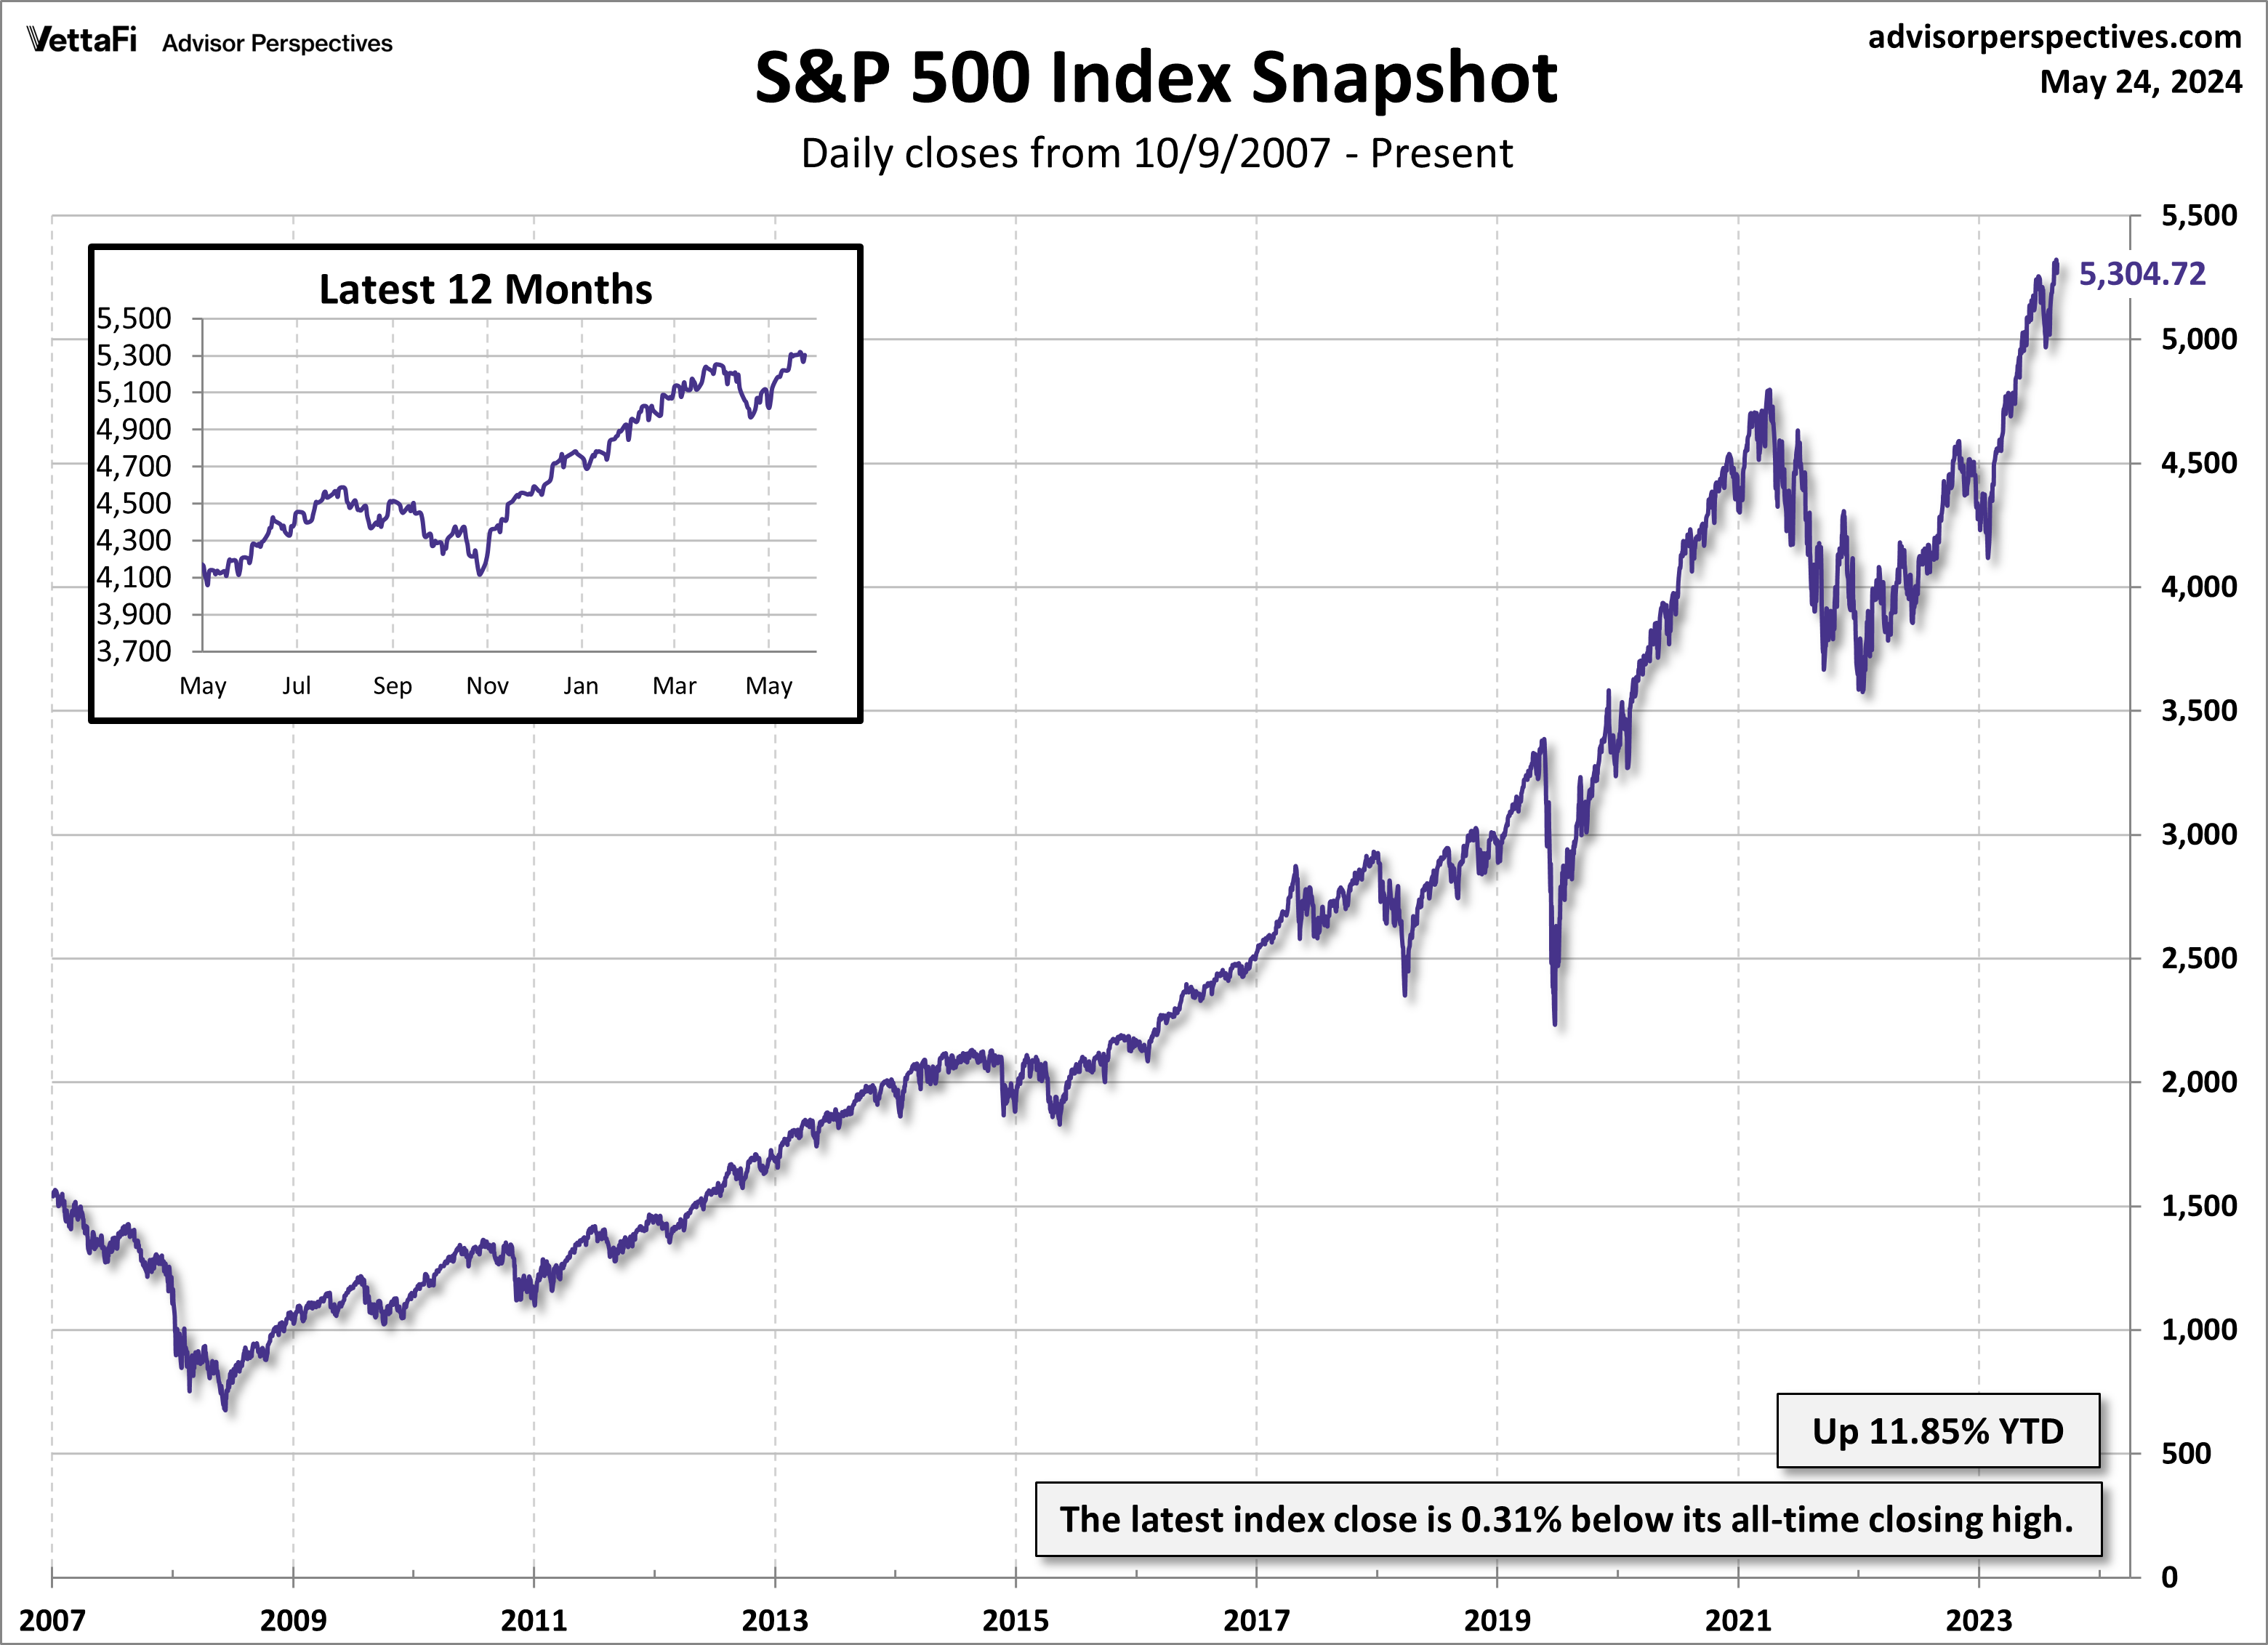
For recent market drops perspective, and related to sawtooth waveforms (sort of), this chart from Doug Short of Advisor Perspectives is handy to look at:

SPX-snapshot.png


from S&P 500 Snapshot: The Rebound Continues - dshort - Advisor Perspectives

As you can see the last correction was in 2011, although we've had several >5% sharp selloffs since.
 
I'm likely the one who misunderstood. There are many people who use "you don't loose money until you sell" as a "stay the course." And maybe I don't understand what anyone is saying. Maybe better I just ask, what do people mean when they say "you don't loose money until you sell"? If I understand HA, you mean you don't realize a loss until you sell, correct?

You don't realize a gain, either. A sale transaction is where value is determined, by the buyer. They're willing to pay a particular price for your 'goods', and the chunk of change you as the seller end up with is the direct measurement of that motivation. Until then, all you have to go on are others' equivalent transactions, if you were to decide then and there to try to execute your own. But if you don't, you defer the determination of value to another day, and another market's proclivities.

It's probably a more-visible dynamic in real estate. I see this a lot: folks who have an inflated idea of what their home is worth, and no one is taking it at the solicited price. No sale, no determination of real value. And, with most homes, it's both the buyer and the mortgage company who determine what will be paid, based on their respective interests in securing 'value'.

So if you use firecalc or other retirement income planner.... how do you determine what values to use?
 
For recent market drops perspective, and related to sawtooth waveforms (sort of), this chart from Doug Short of Advisor Perspectives is handy to look at:

SPX-snapshot.png


from S&P 500 Snapshot: The Rebound Continues - dshort - Advisor Perspectives

As you can see the last correction was in 2011, although we've had several >5% sharp selloffs since.

There are many little sawtooth in that chart, and of less than 10% in magnitude. But if one zooms out, she will see the bigger sawtooths, the less frequent ones that set you back 40 to 60%, like the ones in 2003 and 2008.

The bitty corrections are not scary, and if you are scared of them, well, I do not know what to say. It's the big tsunami ones that can ruin your ER that are fearsome. Heck, not just ER that gets hurt big time, but simple R becomes tough.
 
Last edited:
I'm likely the one who misunderstood. There are many people who use "you don't loose money until you sell" as a "stay the course." And maybe I don't understand what anyone is saying. Maybe better I just ask, what do people mean when they say "you don't loose money until you sell"? If I understand HA, you mean you don't realize a loss until you sell, correct?
I am struck by how hard it is to be sure that a meaning is understood. IMO, the meaning of these terms depends on what you want to know. It is a fact of the tax code that for many (not all ) assets, you do not realize a loss until you sell. That is what it means to realize a loss. But not every purpose is best served by adherence to the tax code. Even if a security is held in a retirement account, when you pull the plug and give up on it it is a loss. Prior to this a position selling for less than it's basis is a a position held at a loss. The distinction I was trying to make was between a loss, whether realized or not, and a draw down. A drawdown is any condition when the security is not at a new high. I usually refer to loss making positions still in my portfolio as positions held at a loss, to distinguish then from realized losses or mere draw downs.

Ha
 
So if you use firecalc or other retirement income planner.... how do you determine what values to use?
Any model, like firecalc, is just a means to speculate about what might happen. And that is how what today's market thinks of your investment is useful, providing a starting point for modeling what might happen.

That's why I like firecalc's monte carlo option; it lets me consider many possible outcomes of my retirement plan in terms of a probability of success. But, none of these outcomes will be exactly what finally happens when I really go to sell shares in order to produce spendable income.
 
Any model, like firecalc, is just a means to speculate about what might happen.

Firecalc (the 'original') doesn't pretend to speculate about what will happen. It merely shows you what has happened. A very important distinction. That's what I like about it.

Predictions about the future are left to the individual.

Per the website:
How can FIRECalc predict future returns from past performance?


It can't. And it doesn't try. In fact, it tries to predict what will not happen. This might sound confusing, but it's really simple.
Consider an analogy: Suppose you are building a house in Honolulu. No one could predict the temperature for any given future date during the decades the house will be used. But if you know that it has never been under 52° in that location in all of recorded history, you could make an intelligent judgment about how much heating capacity is enough.

Now, if you expect for some reason that Honolulu will drift towards Antarctica soon, you might want to adjust the historical observations once you make the step toward speculating (about future returns).

Maybe I'm being pedantic here .. apologies in that case ..
 
Firecalc (the 'original') doesn't pretend to speculate about what will happen. It merely shows you what has happened. A very important distinction. That's what I like about it.

Predictions about the future are left to the individual.

Per the website:


Now, if you expect for some reason that Honolulu will drift towards Antarctica soon, you might want to adjust the historical observations once you make the step toward speculating (about future returns).

Maybe I'm being pedantic here .. apologies in that case ..
you point out a very important distinction about firecalc from most other monte carlo models. A lot of mc models use draws from a statistical function, but firecalc uses actual historical patterns, a better representation of market performance, IMHO. But, both are used to speculate possible outcomes, that's what any mc model is about.

I work with mc analysis at w*rk, and its hard sometimes to keep folks from running wild with the probability numbers. We all need to remember that any mc model, even firecalc, is only an informed speculation.
 
you point out a very important distinction about firecalc from most other monte carlo models.
FireCALC doesn't use Monte Carlo methods. As you mention, it uses actual historical data. This, IMO, is a big advantage, because it preserves all the relationships between assets classes and any year-to-year data relationships that occurred in real life. The down-side to using historical data is that the data set is limited.
 
Any model, like firecalc, is just a means to speculate about what might happen. And that is how what today's market thinks of your investment is useful, providing a starting point for modeling what might happen.

That's why I like firecalc's monte carlo option; it lets me consider many possible outcomes of my retirement plan in terms of a probability of success. But, none of these outcomes will be exactly what finally happens when I really go to sell shares in order to produce spendable income.
I did not intend my question to be about how firecalc does its calculation and the validity of that. One puts in my dollar invested are $X... what ever X is .. say $1MM. So to get that $1MM to put into firecalc is that value just what your brokerage accounts say you have on a given day? Do you average over the brokerage numbers over some period of time (either literally or approximately) and use that number. Or do take the brokerage numbers and subtract out unrealized gains and add back in unrealized losses and use this number? Where do you get the numbers that you put into firecalc.... not what comes out.
 
Do you average over the brokerage numbers over some period of time (either literally or approximately) and use that number. Or do take the brokerage numbers and subtract out unrealized gains and add back in unrealized losses and use this number? Where do you get the numbers that you put into firecalc.... not what comes out.
I'm sure most people just put in the value of their accounts just like they read on the statement (or what they hope they'll be when they retire). If you are concerned that the stock markets are overvalued, I suppose you could put in a number that reflected what your balance would be if stocks were at their historic average P/Es, rather than the "bubbly" prices.
 
I am struck by how hard it is to be sure that a meaning is understood. IMO, the meaning of these terms depends on what you want to know. It is a fact of the tax code that for many (not all ) assets, you do not realize a loss until you sell. That is what it means to realize a loss. But not every purpose is best served by adherence to the tax code. Even if a security is held in a retirement account, when you pull the plug and give up on it it is a loss. Prior to this a position selling for less than it's basis is a a position held at a loss. The distinction I was trying to make was between a loss, whether realized or not, and a draw down. A drawdown is any condition when the security is not at a new high. I usually refer to loss making positions still in my portfolio as positions held at a loss, to distinguish then from realized losses or mere draw downs.

Ha
agreed. one can identify terms for different types of increases and decreases in securities... I'm not implying that these are just made up, look like proper terms. For me when taking a glance at my portfolio it is just a little easier to notice it went up or down. When looking at individual investments there is more information... but I'm not as well versed in the financial speak. The EE speak I do have some background in.

thanks for educating me
 
I'm sure most people just put in the value of their accounts just like they read on the statement (or what they hope they'll be when they retire). If you are concerned that the stock markets are overvalued, I suppose you could put in a number that reflected what your balance would be if stocks were at their historic average P/Es, rather than the "bubbly" prices.
Thank you.
 
I'm sure most people just put in the value of their accounts just like they read on the statement (or what they hope they'll be when they retire). If you are concerned that the stock markets are overvalued, I suppose you could put in a number that reflected what your balance would be if stocks were at their historic average P/Es, rather than the "bubbly" prices.
I wouldn't think subtracting from today's balances would be necessary; FIRECalc will run a scenario where the prices were bubbly and so take that into account. But DO look at FIRECalc's "worst result".

There are many little sawtooth in that chart, and of less than 10% in magnitude. But if one zooms out, she will see the bigger sawtooths, the less frequent ones that set you back 40 to 60%, like the ones in 2003 and 2008.
Those are the ones I'm insuring against by having 7 years to go without selling equities. When people say 2 years, I'm thinking "not nearly enough". Just looking at the S&P 500, with dividends, it looks like roughly 6.2 years from peak to above that old peak for the 2003, and 5.8 years peak to above that old peak for the 2008. And that doesn't count inflation. If you do, then it's 12.7 years from the 2000 peak to break-even. This is according to S&P 500 Return Calculator - Don't Quit Your Day Job... . I've almost talked myself into selling it all! Since August 2000 to May 2015, the return of the S&P 500 has been an inflation adjusted 2%! It's gone down 4.2% since May (only that figured does not including dividends). That's a lot of years to get back to "even". But the alternative was to lose buying power if you were in bonds instead.
 
Back
Top Bottom