Individual FIRECalc results

nadnerb

Dryer sheet aficionado
Joined
Jul 20, 2020
Messages
39
Location
Cleveland, TN
When I put my numbers in FIRECalc, I get a score of 100. The variation in outcomes is enormous. $427K to $16.4M. I would like to see the various time periods and their outcomes to see which dates result in which outcomes. Is there any way to get a printout of the dates and the outcomes?
 
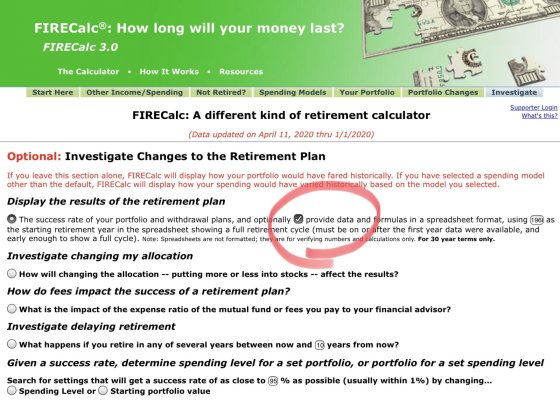
Yep, check the provide data box on the Investigate tab before you hit Submit.
 

Attachments

  • 0079B601-965E-4B9F-A9AF-818DFF8DEF88.jpg
    0079B601-965E-4B9F-A9AF-818DFF8DEF88.jpg
    505.4 KB · Views: 76
Yep, check the provide data box on the Investigate tab before you hit Submit.

I must be doing something wrong. The results summary is the same, but the data in the spreadsheet shows different ending values. On the low side, instead of being $427K it is $2.074M and on the high side it is $35.722M.
 
I must be doing something wrong. The results summary is the same, but the data in the spreadsheet shows different ending values. On the low side, instead of being $427K it is $2.074M and on the high side it is $35.722M.
Not positive but it may be one is inflation adjusted and one not. I have noticed they don’t match but the trends, high, low etc., are identical. So you could adjust them to match but not worth the effort IMO.
 
You may have something else in mind, but I think it would be dangerous to take that data and try to predict whether your retirement year will be more like starting in 1966 or starting in 1984. Because the future will not be just like any equivalent stretch of years in the past.
 
I must be doing something wrong. ...


I suspect so. My results range from 63% to 471% of our current portfolio... and the average is 154% of our current portfolio (30 year time horizon and 100% success).

So our max is 747% of our min while yours is 3,841% of your min.
 
Last edited:
One limitation of Firecalc is that you must estimate your taxes and include that as an expense. That is fine for the retiree that is paying little in taxes, but if you are getting a lot of portfolio growth, then your initial estimates of taxes may be way too low.

So the tool met the objective of determining if you could retire, but to take the optimistic cases too seriously would be stretching it beyond its design. The Firecalc FAQ says it "can't add tax planning without changing the philosophy of the program." and mentions differing tax rates at different historical times. It refers you to programs like i-ORP for tax planning. I've not tried i-ORP so can't help there.

I use the same timeframe in my own spreadsheet and find that the worst case after 30 years was starting in 1892, where the damage was done right near the end, presumably by WWI and their Spanish flu pandemic.

The most number of BWEs (bed-wetting events) where you are convinced you are going to run out of money are the cases starting in the early 1900's. There was a period from 1906-1921 where the market went down hard and took 15 years to recover, then of course after a good 9 year run during the 20's, you get the Depression.
 
One limitation of Firecalc is that you must estimate your taxes and include that as an expense. That is fine for the retiree that is paying little in taxes, but if you are getting a lot of portfolio growth, then your initial estimates of taxes may be way too low.

It would, but would it matter?

I figure that the appropriate number to include for taxes in our annual expense forecast would cover taxes due on the taxable amount of funds I need to withdraw to support our annual expenses as well as any predictable income (e.g., baseline assumption for portfolio growth/capital gains, rental income, etc). Any taxes that are due beyond that because of significant portfolio growth are not included in our long-term planning since they're essentially paid for out of that portfolio growth (with a caveat that the overall effective tax rate could increase because of that growth).

Agree. The way I think about taxes is that the more we have to pay over my calculations, the better shape we’re likely to be in.

To the OP, there’s another copycat fire calculator that is very similar to firecalc that you may find interesting. I don’t think I’m allowed to mention it, but do some googling and you’ll find it. It graphs the ending portfolio value as a function of start year, so you can see what major economic events have had on your final total. I found this presentation of the data a nice complement to firecalc.
 
You may have something else in mind, but I think it would be dangerous to take that data and try to predict whether your retirement year will be more like starting in 1966 or starting in 1984. Because the future will not be just like any equivalent stretch of years in the past.

I get that. Since the variation is so wide, what I am trying to see is which retirement starting years resulted in very low end values, and which retirement years resulted in very high end values and why.
 
I get that. Since the variation is so wide, what I am trying to see is which retirement starting years resulted in very low end values, and which retirement years resulted in very high end values and why.

One important driver of low ending balances is sharp market declines in the early years of retirement. Withdrawals take place from a declining portfolio and it never has the opportunity to grow.

The opposite situation, where the early years enjoy above average investment returns, lead to higher ending balances.

The other factor that leads to portfolio balances on the extremes (either very high or very low ending balances ) is a long lasting multi-year cycle where equity prices post above or below average returns.

All of these situations are unpredictable. We cannot accurately forecast if and when any will take place. This really is the beauty of FIRECalc, because it looks at all the historical asset investment cycles, runs the numbers, and shows you how the portfolio would have fared in each.

One important thing to keep in mind is how you react in the face of extreme volatility (for example, market declines of 01, 08, 20) is critical, and this cannot be modeled by any calculator.
 
I suspect so. My results range from 63% to 471% of our current portfolio... and the average is 154% of our current portfolio (30 year time horizon and 100% success).

So our max is 747% of our min while yours is 3,841% of your min.

I agree with you. My point is that the stated results are different than the spreadsheet shows. My results starting with $2.7M range from $427K to $16.4M. Which is 15% to 607% of my starting value and closer to your range. HOWEVER, the spreadsheet does not match those final values. The resulting spreadsheet shows final values ranging from $2.07 to $35.7
 
Last edited:
One important driver of low ending balances is sharp market declines in the early years of retirement. Withdrawals take place from a declining portfolio and it never has the opportunity to grow.

The opposite situation, where the early years enjoy above average investment returns, lead to higher ending balances.

The other factor that leads to portfolio balances on the extremes (either very high or very low ending balances ) is a long lasting multi-year cycle where equity prices post above or below average returns.

All of these situations are unpredictable. We cannot accurately forecast if and when any will take place. This really is the beauty of FIRECalc, because it looks at all the historical asset investment cycles, runs the numbers, and shows you how the portfolio would have fared in each.

One important thing to keep in mind is how you react in the face of extreme volatility (for example, market declines of 01, 08, 20) is critical, and this cannot be modeled by any calculator.

Thanks for the reply. I understand the impact of initial years on the portfolio. I'm a bit of a data nerd, and wanted to see the underlying data to see how the various years played out. Using your example, how did 01 compare to 99, 00, 02, 03, 04? However, the data in the spreadsheet does not match the stated outcomes.
 
One important driver of low ending balances is sharp market declines in the early years of retirement. Withdrawals take place from a declining portfolio and it never has the opportunity to grow.

.

Just as important would be high inflation in the early years of retirement.
 
Thanks for the reply. I understand the impact of initial years on the portfolio. I'm a bit of a data nerd, and wanted to see the underlying data to see how the various years played out. Using your example, how did 01 compare to 99, 00, 02, 03, 04? However, the data in the spreadsheet does not match the stated outcomes.

Then look at the calculator i mentioned upthread. That’s exactly what it does.

I found it very helpful personally. I had not appreciated the impact of stagflation. Once I saw that we would have survived the depression years I felt much more confident about our plan.
 
Back
Top Bottom