Inflation adjusted, effective income tax rates

IndependentlyPoor

Thinks s/he gets paid by the post
Joined
Jul 1, 2009
Messages
1,142
Location
Austin
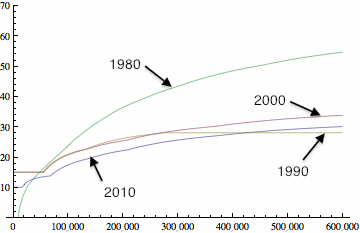
I was bored, so I decided to plot out the effective income tax rates for several years. Been wanting to do this for a long time. All dollars in constant 2010 dollars.
Effective FIT.gif
Whether one is in favor of it or not, tax rates have certainly become less progressive. As Ziggy has pointed out, this does not capture the effect of closing loopholes that came with the Reagan reductions.

If I get motivated, I might add a few more years in the 50s, 60s, and 70s.

Tax data from:
http://www.taxfoundation.org/files/fed_individual_rate_history-june2010.xls
CPI data from
http://www.econ.yale.edu/~shiller/data/ie_data.xls
 
As Ziggy has pointed out, this does not capture the effect of closing loopholes that came with the Reagan reductions.

Doesn't that make it all for naught?

Why not look at inflation adjusted tax receipts for various inflation adjusted income levels? That tells us what was actually paid, which tells us more than a % number on a tax bracket that is subject to revision through 'loopholes'.

Even that is questionable, as I see 'AGI' as a rather fictitious number, and I'm not sure the current receipts take into account the 'refundable tax credits'.

-ERD50

All true. I was thinking about doing the tax receipts. Might still, however, I agree that AGI has a lot of wiggle room.

OTOH, how does one form an option without some data?
 
Rummaging around looking for better data on actual taxes paid and ran across this.
progressive.gif


This might be close to what I was looking for, at least for 2008. Doing the same analysis for historical data is gonna be a lotta work.

From:
Are federal taxes progressive?
 
Thanks, that is probably a better way to look at it. Of course, we must keep in mind that that "lowest quintile" is "of those who pay FIT". From that source:

About 40 percent of tax units will pay no individual income tax or will receive a net subsidy for 2008;

-ERD50
 
Of course, we must keep in mind that that "lowest quintile" is "of those who pay FIT".
I did not read the chart as excluding those who pay no FIT (since it includes all taxes, including payroll taxes). The quintiles are simply of "cash income". I think the fact that 40% pay no FIT is reflected in the low overall number for that quintile.
 
Thanks, that is probably a better way to look at it. Of course, we must keep in mind that that "lowest quintile" is "of those who pay FIT".
Not necessarily. Note that this graph includes payroll taxes (7.65% for most of us, 15.3% for the self-employed), and yet their tax burden is 1.1% *including payroll tax*. That to me suggests the group has an effective negative income tax which, when combined with payroll taxes, is +1.1%.

It's not clear whether the employer portion of payroll taxes is included here; all that would change is just *how* negative the effective income tax rate would be.
 
I did not read the chart as excluding those who pay no FIT (since it includes all taxes, including payroll taxes). The quintiles are simply of "cash income". I think the fact that 40% pay no FIT is reflected in the low overall number for that quintile.

Yes, thanks - looks like you are right. I'm so used to seeing it in that form, I didn't read the fine print that included 'payroll tax' in there.

-ERD50
 
The CBO does regular reports on total effective rates. Here's one: Congressional Budget Office - Distribution of Federal Taxes

Google on: Effective Federal Tax Rates site:cbo.gov
to get more samples.

BUT, be aware of their assumptions.
1) They pick up both halves of SS and Medicare and apply them to the worker.
2) They treat refundable tax credits as negative taxes rather than as welfare.
3) The assume that 100% of corporate income tax is paid by the owners of capital.

I think (1) is very safe, (2) is questionable, and (3) is wrong.

If you're interested in the very rich, the IRS does an annual report on the 400 top reported incomes. IIRC, in the most recent year, the average income in that group was $345 million, and the average FIT rate was 16%. FICA would be trivial, the real question would be corporate income tax.
 
Back
Top Bottom