Senator
Thinks s/he gets paid by the post
What would a bond portfolio look like after inflation? That is a better comparison...
You will likely find it worse.
You will likely find it worse.

What would a bond portfolio look like after inflation? That is a better comparison...
You will likely find it worse.
From 1/1/2000 to 12/18/2014, a $10K deposit grows to $18,014 (dividend reinvested), which is an annualized return of 4.3%. However, that is before inflation, which runs 40% cumulative in that period. The $18K becomes $12.87K after inflation, which is an annualized return of 1.8%/yr.

Get ready to make the magic noise. But maybe wait until after Jan 2nd for those of us rebalancing on the first trading day of the year?
I thought today we might have a new closing all-time-high. Intraday high is 2079 something, closing high 2075.4 or thereabouts.
Just wish the Int'l markets would produce some good returns.
VWO has been a red drag for years in my portfolio.
I sometimes wonder what following the 'rule of thumb' of 10% in Int'l equities gets me - its enough of a drag to make me grind my teeth with their lack luster returns , and yet if they do 'well' not enough to make much of a difference.
Please hold off any excited happy noises until after Jan 2nd.
Thank you!
The Start-of-Year Rebalancers
p.s. S&P500 trading above 2080. Update - new intra-day all time high, and new closing high of 2,082.21.
Nothing here to be excited about, folks, just move right along...Just wish the Int'l markets would produce some good returns.
VWO has been a red drag for years in my portfolio.
I sometimes wonder what following the 'rule of thumb' of 10% in Int'l equities gets me - its enough of a drag to make me grind my teeth with their lack luster returns , and yet if they do 'well' not enough to make much of a difference.
I wonder if a lot of excited happy noises will bring down the S&P and propel the international stocks up. It's worth a shot, don't you think?
Sure, but let's save that for next year, so that we rebalancers can buy our international when it is still down.
Every so often, to tamper our enthusiasm about equities, we should look at a graph like the one below that I linked in from simplestockinvesting-dot-com. Except for during the secular bull market of 1983-2000, buy-and-holders do not do that well.
For the most recent period of 2000-2013, only people who bought the dips got ahead. These buyers are either younger accumulators with fresh cash, or retirees who rebalance or hold balanced funds that rebalance for them. Buy-and-holders got nowhere.
And look how much investors lost in the period of 1967-1985, even with dividends all reinvested and a WR of 0.
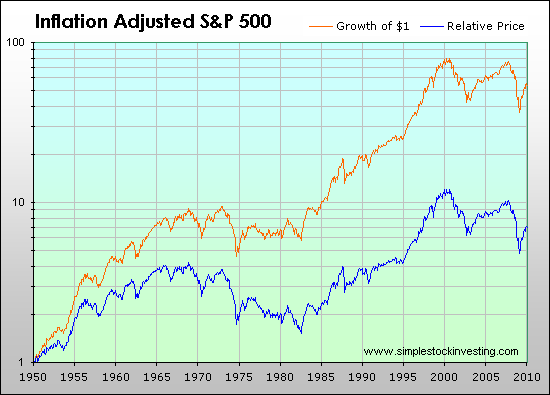
You may want to look at this graph again, as the Y coordinate is not linear, but appears to be logarithmic. There isn't anything about this that is flat, except the 2000-2010 decade, which contained 2002 (after 9/11) and the 2008 meltdown with stocks bottoming out in March of 2009. Investors "lost" between 1967 and 1985 because of runaway inflation. Despite that, a dollar invested in 1950 turned into $55 in 2010, after being adjusted for inflation. This appears to me to be an argument for a buy and hold strategy, rather than against it.
When I wrote "flat", I meant periods when the S&P had the same value at the start and end of the periods.You may want to look at this graph again, as the Y coordinate is not linear, but appears to be logarithmic. There isn't anything about this that is flat, except the 2000-2010 decade, which contained 2002 (after 9/11) and the 2008 meltdown with stocks bottoming out in March of 2009.
Investors "lost" between 1967 and 1985 because of runaway inflation. Despite that, a dollar invested in 1950 turned into $55 in 2010, after being adjusted for inflation. This appears to me to be an argument for a buy and hold strategy, rather than against it.
Sure, but let's save that for next year, so that we rebalancers can buy our international when it is still down.