music-and-ski
Recycles dryer sheets
Following up on my analysis of expenditure data by Canadians https://www.early-retirement.org/forums/f28/canada-expenditure-data-for-65-a-104390.html , I downloaded the 2016 Survey of Financial Security to look at net worth.
The net worth distribution of 2 person households in the 45-64 age bracket is
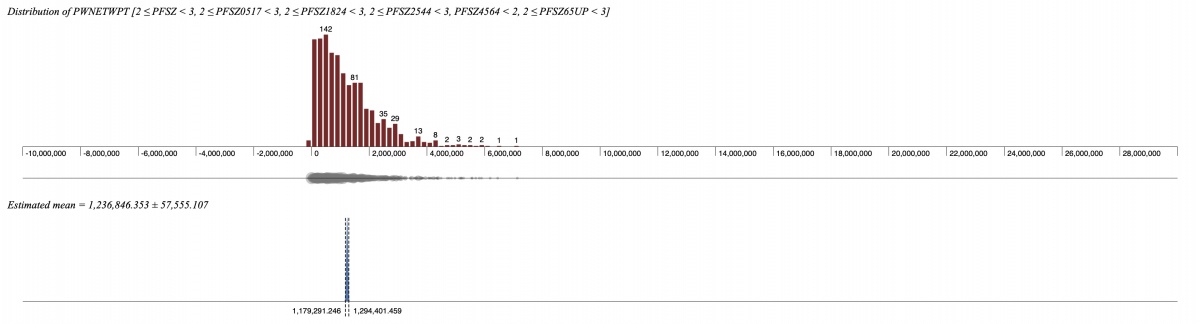
the mean is 1.2M.
The net worth distribution of 1 person households in the 45-64 age bracket is
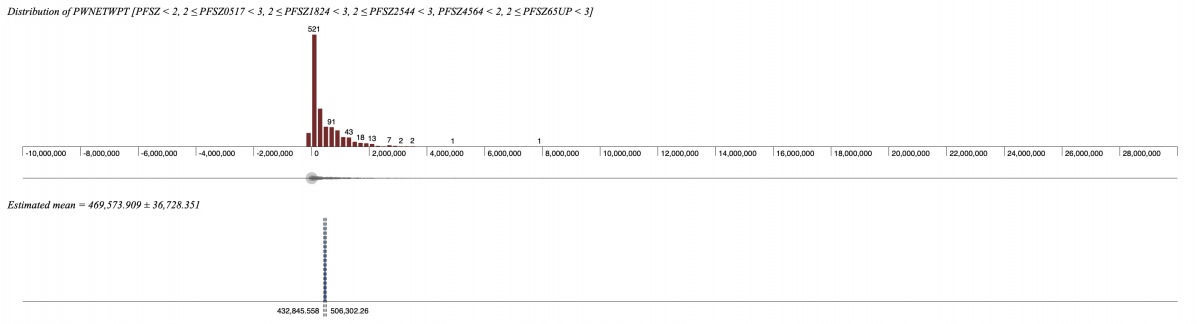
the mean is 470K.
The net worth distribution of 1 person households in the 65+ age bracket is
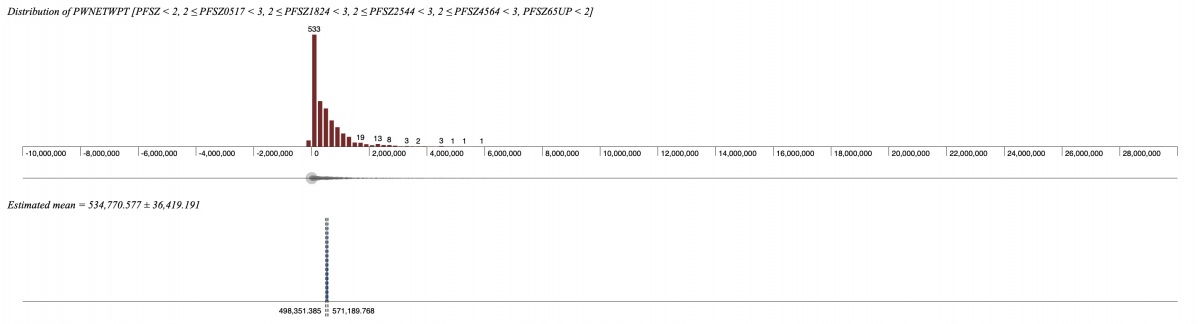
the mean is 535K.
The net worth distribution of 2 person households in the 65+ age bracket is
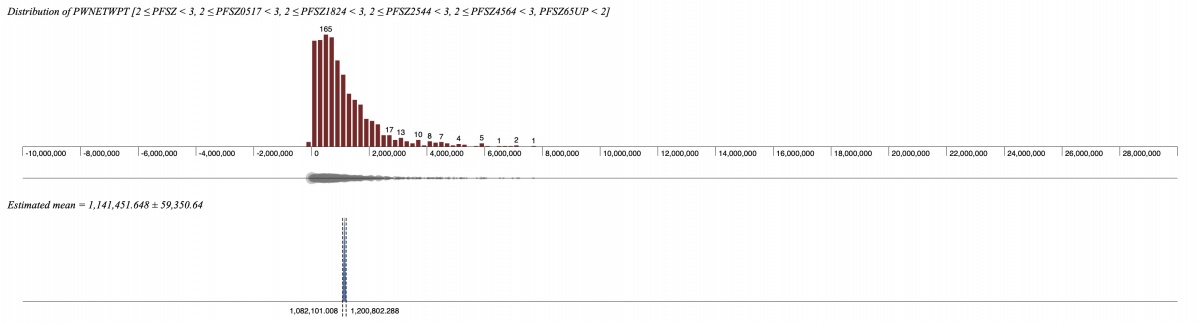
the mean is 1.4M
I primarily post these because I'm afraid to early retire, even though my NW is substantially above these mean values. Now I know that if I could get my spending down, I could retire, like other people in this survey do.
Maybe this one is more important. This is for families where everyone is over 44 years old and their major income source is investment income or retirement pensions. That is, these people aren't counting "Wages and salaries", "Self-employment income", "Government Transfers" nor "Other income" as their "Major source of income for the family unit". So, these people are retired. The distribution is

The mean value is 1.34M
Note all these NW calculations includes the value of pensions.
So, if you are Canadian, and your NW is over 2M, and you don't think you can retire, you probably have a spending problem...
The net worth distribution of 2 person households in the 45-64 age bracket is
the mean is 1.2M.
The net worth distribution of 1 person households in the 45-64 age bracket is
the mean is 470K.
The net worth distribution of 1 person households in the 65+ age bracket is
the mean is 535K.
The net worth distribution of 2 person households in the 65+ age bracket is
the mean is 1.4M
I primarily post these because I'm afraid to early retire, even though my NW is substantially above these mean values. Now I know that if I could get my spending down, I could retire, like other people in this survey do.
Maybe this one is more important. This is for families where everyone is over 44 years old and their major income source is investment income or retirement pensions. That is, these people aren't counting "Wages and salaries", "Self-employment income", "Government Transfers" nor "Other income" as their "Major source of income for the family unit". So, these people are retired. The distribution is
The mean value is 1.34M
Note all these NW calculations includes the value of pensions.
So, if you are Canadian, and your NW is over 2M, and you don't think you can retire, you probably have a spending problem...
 I guess the devil is always in the details just as in every other aspect of financial survival. So YMMV.