Portfolio for 4% SWR for 30 yr. survival

Often people say, (challengingly) "Do you expect something worse than the great depression?" This reflects a lack of understanding, or a bald attempt at manipulation. True that the 1929-193x depression was bad, but perhaps not the worst conditions for portfolio survival. Deflation rather than inflation for one. Deflation has some real advantages for well fixed retirees.

The truth is, no one in the '30s and no one today can know what to expect. The 30s gave us one spin of the wheel on the conditions of the 30s. There might have been a whole universe of alternate spins, even given the same antecedent conditions.

I will say that this board has gotten a lot more circumspect over the years. Fewer people blandly quote possibly meaningless statistics and past histories that will never recur the same way, while urging other people to make possibly rash decisions.

Ha
 
One of the risks that doesn't show up in traditional Firecalc simulations is the risk (usually at higher equity allocations) that you don't stick to your allocation and re-balance. Some people don't have the nerve to re-balance to their 65 or 70% equity allocation when their equity value has just plunged 60%.

Wimps!

Seriously, another way to look at those charts is that since it is so flat down to ~ 40% equities, so no one should feel 'bad' if they need to keep down to 40% equities to sleep at night. They'll probably do about as well (success % wise, probably not terminal value wise) as any higher AA.

I do know some people who sold all their stocks at the lows - they did lose their nerve. But they're not on track to ER either, I suspect they may need to pay more 'tuition'.


-ERD50
 
Last edited:
I re-read Bengen's first two papers today and was amazed at how insightful they were. Also, very readable.

A couple of examples
- Like Ha points out above, Bengen proves that the 70s were much worse for portfolio survival because of inflation than the period from 1929-31 which saw equities fall 61%
- He tackles the options facing a person 10 years into retirement if their portfolios fare badly (calls them black holes) or really well (calls them Stars) or just right (asteroids).
- He proposes a reduction in consumption as one of the ways out for a "black hole" & shows how even a modest reduction in spending would extend portfolio survival.
- He points out exactly the issue that jebmke brings up above. The risk of bailing from a high-equity AA at just the wrong time.
- In the second paper he tackles an "age in bonds" method, and also looks at the scenarios - a regular retiree (age 65), an early retiree (age 50), and a young person saving for retirement.

Our thinking about asset location has evolved (I think ) from the time he wrote these papers. In his second paper, he uses separate equity/bond allocations for taxable & tax deferred accounts. Today, I think most would focus first on asset location.

Bengen wrote 5 papers on the subject and I think all are worth reading. They also show the progress he makes in his thinking about the subject.
You can find links to the papers on this wikipedia page

What a lot of this points out is how difficult it is for an individual to manage his portfolio for over several decades.

In the portfolio Vs Pension thread
http://www.early-retirement.org/forums/f27/pension-or-portfolio-52770.html
I voted for the pension from the federal Gov't.
Because of the following variables:
No risk of default
No market risk - stocks/bond
No bad investment risk (my stupidity)
No aging risk (meaning as I age I might not be able to manage the $)

No potential increase in taxes risk on capital gains, dividends, other stock/bond etc.
No inflation risk

I think the two bolded items are two major risks not given enough weighting.

For the next 7 years I am focusing on principal conservation; growth second. After that time I will begin collecting SS which will take off some of the pressure. I'm OK with being in cash for a few months since inflation is low. However, I would be in trouble if we were in a 1970s type inflation period.

Most money is made during secular bull markets - 1983 to 2000. In secular bears (current market) holding onto your money is key. I estimate I have 30 years 2010 - 40 to manage my money. I see a lot of challenges e.g. tax increases, reduction in SS benefits to overcome.
However, looking back at history, what 30 year didn't have such challenges.

I do think we will have an inflationary period towards the end of this decade. (How bad I do not know.) The individual can not beat an inflationary period. To do so they would not only beat the inflation percentage but the taxes to be paid on any gains.

The older I get the more I think I will become like UncleMick Pssssst Wellesly.
 
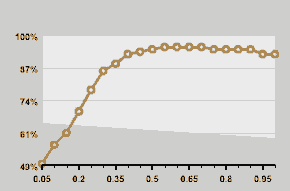
Contrarian, here is a graph to illustrate what MichaelB is saying (sorry for the poor image quality):

img_1001506_0_cdb87660c228357b7109e684afa477ff.gif


Note that once the equity allocation reaches 0.40 on the X axis, the 30 year survivability % flattens out and improves very little as the equity allocation increases.


One of the things that this does not address if the return of a higher % of stock... IOW, your chance of having a failed portfolio is 'similar' fro 40% to 100%.... but the size of that portfolio can be quite different if you go with a higher stock %....

So a 40% might be OK... but you might not have a lot of assets when you die... whereas if you went 70% your probability of having a larger estate is higher....

(not sure if I am saying this where people are understanding... hope so)...
 
So a 40% might be OK... but you might not have a lot of assets when you die... whereas if you went 70% your probability of having a larger estate is higher....

(not sure if I am saying this where people are understanding... hope so)...

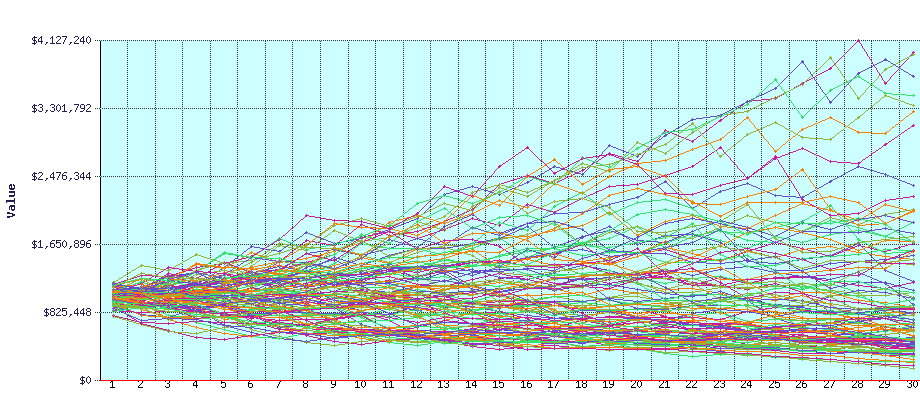
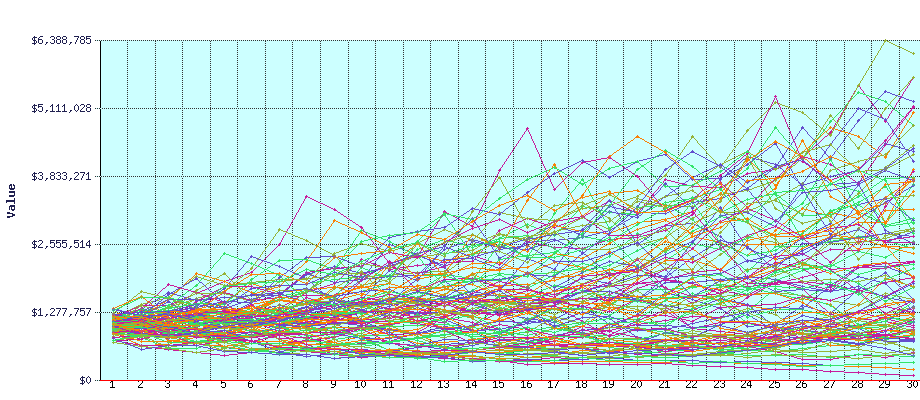
Here are two graphs, 35% and 75% EQ with a 3.5% WR, but FIRECALC kicks them out on different scales. The one with 35% is pretty sparse when it comes to terminal portfolios above ~ $2.5M, but it's not uncommon at all with 75%.

If you have any hopes at all for an Anna-Nicole Smith thing going on in your old age, shoot for the high EQ portfolio. I'd be happy to trade some potentially high EOL portfolio number for security, but my impression is that you just trade one demon (stock market risk) for another demon (inflation risk).


(hopefully I get the images in right, I don't do this often enough to be sure)

-ERD50
 

Attachments

  • 35% eq 3.5% swr line-graph.php.png
    35% eq 3.5% swr line-graph.php.png
    49.7 KB · Views: 15
  • 75% eq 3.5% swr line-graph.php.png
    75% eq 3.5% swr line-graph.php.png
    62 KB · Views: 14
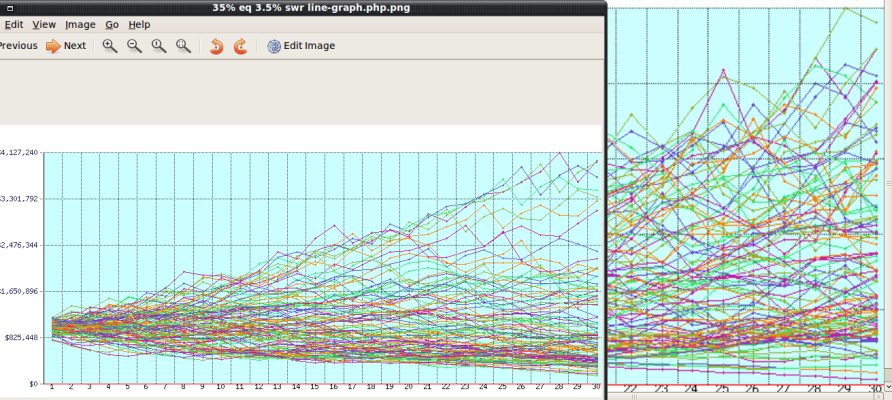
OK, here's another shot where I crudely zoomed one to get the scales pretty well lined up (sort of). You can see a whole grouping of 30 year portfolios ending at about half their starting value with 35% equities, but very, very few in that area with 75% equities.

Historically speaking, so all bets are off, unless you are visiting this forum from 1980 ;)


-ERD50
 

Attachments

  • 35%-75% same scale .png
    35%-75% same scale .png
    358.4 KB · Views: 10
Here are two graphs, 35% and 75% EQ with a 3.5% WR, but FIRECALC kicks them out on different scales. The one with 35% is pretty sparse when it comes to terminal portfolios above ~ $2.5M, but it's not uncommon at all with 75%.

If you have any hopes at all for an Anna-Nicole Smith thing going on in your old age, shoot for the high EQ portfolio. I'd be happy to trade some potentially high EOL portfolio number for security, but my impression is that you just trade one demon (stock market risk) for another demon (inflation risk).


(hopefully I get the images in right, I don't do this often enough to be sure)

-ERD50

Eyeballing the charts it looks like scenario 1 averages between 1.2 - 1.5m and scenario 2 average between 2.2 - 2.4m at the end.

I'd say you have been a success if you lived the life you want and die with some money in the bank.
 
I'd be happy to trade some potentially high EOL portfolio number for security, but my impression is that you just trade one demon (stock market risk) for another demon (inflation risk).

I wonder if stock's inflation hedge credentials aren't oversold. It seems to me the idea that stocks offer better protection from inflation comes from their higher historic returns generally. Not so much from high returns, or even inflation beating returns, during periods of inflation.

The 30 year period beginning in 1965 is a good illustration. This is a time when 4% proved not to be safe, but one would assume that a high equity allocation would fare better considering the higher than average inflation. But a 75% equity portfolio lasted no longer than a 40% equity portfolio. In fact, the 40% equity portfolio lasted a year longer. And I imagine a healthy slug of TIPS would have gotten you to the finish line.

So it may be that the higher equity allocations aren't really protecting against high inflation. It could be there only benefit is the potential for an Anna Nicole payoff in the twilight years.
 
Sometimes the best time to spend is when the market is down. That often coincides with an economic downturn and you can take advantage of lower or more stable prices etc. We have used the downturn to get a few things done on our house - contractors are available and willing to work for less to keep their workforce busy.

While I agree you can get some great deals during an economic downturn, you can also decimate your portfolio by withdrawing too much when your asset prices are down. Dealing with both of these issues is a very fine line. :cool:
 
Bob Clyatt presents a 4%/95% spending plan in Work Less, Live More that varies with portfolio performance to allow a more flexible withdrawal.

Like Jeb says, recessions are a great time to do business. We'd been stalking a major home improvement (stamped concrete) for nearly a decade, and as we got closer to doing it (2005) we had a heck of a time finding any contractors willing to talk to us. But by late 2008 we had everyone's interest and got a great (much of it cash) price.

Nords - I have read Bob's book. Great stuff.

Yes, it is nice in recessions to get contractors to at least return your calls.

Mahalo nui loa.
 
Au contraire! I found this the other day while looking for something else:
http://www.ifid.ca/pdf_newsletters/PFA_2006OCT_Buckets.pdf
where Milevsky shows that buckets don't always help you. The last sentence in the article

It is so discouraging to see the 'experts' get it wrong. :)

I'll add that I think the quote is correct - nothing is 100% safe. My cash bucket comment was directed only at the caution you didn't want to have to sell depressed assets in an downturn.
 
Au contraire! I found this the other day while looking for something else:
http://www.ifid.ca/pdf_newsletters/PFA_2006OCT_Buckets.pdf
where Milevsky shows that buckets don't always help you. The last sentence in the article
I started reading the article but on the first page I found this
To make this a fair apples-to-apples comparison I must arrange my story so that all else is equal, or as economists say ceteris paribus.
I must have some type of post-hyptnotic suggestion planted in my mind because whenever I read "ceteris paribus" my mind goes blank. I'll try again later but the odds are against making it all the way through...
 
I'll try again later but the odds are against making it all the way through...

I'll save you the trouble. The punchline of his 'counter example' is that "Investor A", who spends down his cash position in a multi-year declining equity environment increases their equity allocation along the way, and therefore, increases their exposure to future year's decline. So at the end of a hypothetical three year bear market, Investor A who spends down cash positions first has a smaller portfolio balance, and a higher equity allocation, than does Investor B, who rebalanced along the way.

One of the simplifying assumptions (implied, but not directly stated) is that period returns are completely independent, rather than mean reverting. So, although Investor A has a smaller portfolio balance, he's increasing his exposure to what should be an increasingly attractive asset class. But the point remains, the "buckets" approach caused more downward volatility in a multi-year bear market, rather than less.
 
I wonder if stock's inflation hedge credentials aren't oversold. It seems to me the idea that stocks offer better protection from inflation comes from their higher historic returns generally. Not so much from high returns, or even inflation beating returns, during periods of inflation.

The 30 year period beginning in 1965 is a good illustration. This is a time when 4% proved not to be safe, but one would assume that a high equity allocation would fare better considering the higher than average inflation. But a 75% equity portfolio lasted no longer than a 40% equity portfolio. In fact, the 40% equity portfolio lasted a year longer. And I imagine a healthy slug of TIPS would have gotten you to the finish line.

I haven't analyzed it down to the specific years, I was just looking at the rough groupings there. I'll assume your analysis is correct though, but yet, how does that help us? It seems to me that it only helps if we know what's coming. Then we could tailor our portfolio to match. So I am generalizing, and saying that generally 75% EQ did better than 35%. So assuming the future scenarios are distributed roughly like past scenarios (not a good assumption, but I don't know of a better one that I can learn from), it would still seem to favor a fairly high EQ%. What can we dobut generalize about the future?

But it's still interesting that bonds would do better during those high inflation years, that does seem contrary to what most of us would expect.

It could be their only benefit is the potential for an Anna Nicole payoff in the twilight years.

And let's not minimize the value of such benefits! I remember the photos in the paper at the time of the wedding, before all the other stuff and before Anna-Nicole became famous/infamous. I will never forget the smile on that guys face! Hah, he looked like he knew full she was marrying him for his money, and I think he felt it was a pretty good deal! Ya' can't take it with you! :ROFLMAO:

-ERD50
 
In the mid 70s my wife put $10K into "small growth" common stock mutual fund IRA, then we pretty much forgot about it -- usually didn't even open the annual statements. It's 160K, now. That's my idea of portfolio management. Nothing in, nothing out, no "rebalancing".
 
But it's still interesting that bonds would do better during those high inflation years, that does seem contrary to what most of us would expect.

That was probably my only point. People claim that stocks provide a hedge against inflation, but I think it might be a pretty lousy hedge. Current stock prices reflect a discounting of future cash flow, just like bonds. So when inflation rises above current expectations, stock multiples have to come down to reflect higher discount rates. One could (will?) argue that stock's nominal cash flow should increase with inflation, but despite this, we still watched stock multiples decline to single digits from the low 20's during the 1970's.

And a somewhat overlooked aspect of bonds is the ability to reinvest proceeds from maturities or coupons at higher rates. Short-duration instruments should hold their purchasing power relatively well. Perhaps much better than stocks.

And let's not minimize the value of such benefits!

Agreed. The other benefit is providing insurance against longevity risk . . . although Anna will do a good job taking care of that for you as well.
 
I'll save you the trouble. The punchline of his 'counter example' is that "Investor A", who spends down his cash position in a multi-year declining equity environment increases their equity allocation along the way, and therefore, increases their exposure to future year's decline. So at the end of a hypothetical three year bear market, Investor A who spends down cash positions first has a smaller portfolio balance, and a higher equity allocation, than does Investor B, who rebalanced along the way.

One of the simplifying assumptions (implied, but not directly stated) is that period returns are completely independent, rather than mean reverting. So, although Investor A has a smaller portfolio balance, he's increasing his exposure to what should be an increasingly attractive asset class. But the point remains, the "buckets" approach caused more downward volatility in a multi-year bear market, rather than less.
Thanks.
 
Hi all:

Just joined this forum, but I have been familiar with you guys for quite some time. This is a useful and insightful thread. Your conclusions with regard to the 'sweet spot' in equity allocation at retirement is one that very few people seem to understand.

I will throw in just a few thoughts.

First, the long historical histories of a stock index return as used in Firecalc show a picture of stocks that implies more certainty than we have. First and foremost, there is reason to believe that the equity risk premium will be lower in the future than it was over the last hundred years or so in the US. The last hundred years-the American Century-have been very kind to stock investors. Next, we have the fact that the makeup of the S&P500 has changed. Even twenty years ago, the vast majority of S&P500 firms paid dividends. Today, a relatively small number do so. This reflects a major change in corporate governance that does not seem to favor investors. In other words, really old historical data on stocks is not a good predictor.

Target date funds in the retirement year hold, on average, less than 50% of their allocations in stocks, FWIW.

The discussion of why you seem to have higher survival rates with riskier equity classes makes perfect sense--and you can therefore get away with lower allocations to equities if the equities are riskier (small cap and value) or more emerging markets, etc.

I was surprised that there was not more discussion of TIPS as an important asset class for keeping up with inflation. How come?
 
I was surprised that there was not more discussion of TIPS as an important asset class for keeping up with inflation. How come?


Welcome Geoff :greetings10:

Just put TIPS in the Google Search bar at the top and search Early-Retirement.org. You'll find plenty of discussion of TIPS - I hope you have plenty of free time...
 
First, the long historical histories of a stock index return as used in Firecalc show a picture of stocks that implies more certainty than we have. First and foremost, there is reason to believe that the equity risk premium will be lower in the future than it was over the last hundred years or so in the US. The last hundred years-the American Century-have been very kind to stock investors. Next, we have the fact that the makeup of the S&P500 has changed. Even twenty years ago, the vast majority of S&P500 firms paid dividends. Today, a relatively small number do so. This reflects a major change in corporate governance that does not seem to favor investors. In other words, really old historical data on stocks is not a good predictor.

Hi Geoff and welcome. If you had a time machine, you could go back to any moment in U.S. history and find 101 reasons, many as good as any you have listed, not to invest in stocks for the long term. Do you really think you and I are exceptional enough to be alive and investing at the one moment when everything reverses? I dont.
 
Back
Top Bottom