Protect SS, it's important

Sometimes they do, sometimes they don't.
Some reading for those who haven't yet made up their mind.

Supply-Side Economics: The Concise Encyclopedia of Economics | Library of Economics and Liberty

Bottom line--the effects of tax cuts in enhancing government revenues are long-term rather than short-term, and more pronounced if marginal rates are higher.

Laffer and others note that government revenues increase with tax rate decreases only when the existing tax rates are in the right portion of the curve.

(Figure from Wikipedia)

Laffer curve: t** represents the rate of taxation at which maximal revenue is generated. Here the curve is symmetric for simplicity, which is not realistic.
 
Some reading for those who haven't yet made up their mind.

Supply-Side Economics: The Concise Encyclopedia of Economics | Library of Economics and Liberty

Bottom line--the effects of tax cuts in enhancing government revenues are long-term rather than short-term, and more pronounced if marginal rates are higher.

Laffer and others note that government revenues increase with tax rate decreases only when the existing tax rates are in the right portion of the curve.

(Figure from Wikipedia)

Laffer curve: t** represents the rate of taxation at which maximal revenue is generated. Here the curve is symmetric for simplicity, which is not realistic.

I expect everyone accepts that some level of taxation is necessary, although I bet there are some that would even argue that point. The problem then becomes to decide what it should pay for and how it should be levied. The difficulty with this is that it's an almost infinitely complex series of differential equations with dependent variables. Napkin curves like Laffer's offer only the most simplistic insight into the problem.
 
Napkin curves like Laffer's offer only the most simplistic insight into the problem.
True, just as Laffer himself said. The Laffer Curve is much more a rhetorical/explanatory tool than a precise econometric model. But, there's some tax rate above which government revenues will decrease, not increase. And, there's no doubt that US government revenues have sometimes increased after decreases in tax rates, but that's no firm proof of causality.

And, just to be clear, I resist the notion that our goal should be to find that optimum tax rate that produces the highest government revenue (i.e. just as a physician shouldn't ask "How much can we bleed the patient each day to gain the greatest amount of blood over time--if we take too much he gets so sickly that output decreases." Our goal should be on the health of the patient--our people, and the private economy that sustains us).
 
I chose age 5 because the original suggestion was to increase retirement age for everyone born after 2000, and the age 5's were the first age group in the statistics who would fit that description.

Ok, gotcha. But that leads to other complexities - we don't know what their LEs will be at retirement or after they've paid into the system for a while. The data you presented shows how tricky it gets, with the LE going back-and-forth between the groups at different times. That's why I'm saying 'forget about it' (as far as SS goes), and treat SS as it was intended, an annuity for life. So that does not come across as cold, let me add that it would be good for this country to understand the underlying issues of why the poor have lower LE, and to try to improve that (the obvious answer is fewer poor people, but at least address specific issues of the poor). If some of it is unique to gender or race, that would come out as part of the research.
Neither Emeritus nor I suggested that policy should be based on this. You "called him out" for something he didn't say. ... Maybe this discrepancy is, as suggested elsewhere in the thread, more of a high income/low income effect, and partly or fully canceled out by the progressive nature of SS benefits.

True, I wasn't clear - let me expand a bit.

I didn't mean to imply that either of you said that policy should be based on this (neither did). I was asking if you think we should base policy on this, otherwise - why bring it up? And why define it in terms of race, when (as samclem reminded us) it is probably more appropriate to say that people with low LE would be disproportionately affected - generally the poor, people with medical conditions, poor genes, addiction or other risky behaviors, or bad lifestyle choices (addiction may not be a "choice").


Securing the general Welfare is one of the reasons people founded this country.

OK. But raising the retirement age for SS (if that is what you are referring to) in the future is an awfully l-o-o-o-o-o-o-n-g stretch from our Founding Fathers. Outside of the military, this sort of "general welfare" did not seem to be legislated much.

An aside: The stuff I learn reading/researching on this forum! I googled US military pension history - if internet forums existed in the late 1700's I think we'd be surprised how little has changed:

Public Sector Pensions in the United States | Economic History Services

Congress authorized the payment of a life annuity, equal to one-half base pay, to all officers remaining in the service for the duration of the Revolution. It was not long before Congress and the officers in question realized that the national governments' cash-flow situation and the present value of its future revenues were insufficient to meet this promise. Ultimately, the leaders of the disgruntled officers met at Newburgh, New York and pressed their demands on Congress, and in the spring of 1783, Congress converted the life annuities to a fixed-term payment equal to full pay for five years. Even these more limited obligations were not fully paid to qualifying veterans, and only the direct intervention of George Washington defused a potential coup (Ferguson 1961; Middlekauff 1982).

-ERD50
 
True, just as Laffer himself said. The Laffer Curve is much more a rhetorical/explanatory tool than a precise econometric model. But, there's some tax rate above which government revenues will decrease, not increase. And, there's no doubt that US government revenues have sometimes increased after decreases in tax rates, but that's no firm proof of causality.

And, just to be clear, I resist the notion that our goal should be to find that optimum tax rate that produces the highest government revenue (i.e. just as a physician shouldn't ask "How much can we bleed the patient each day to gain the greatest amount of blood over time--if we take too much he gets so sickly that output decreases." Our goal should be on the health of the patient--our people, and the private economy that sustains us).

I agree with your stated goal Sam. But there's enough arc between the 35% rate and the 50% rate on Art's curve to restore the lost revenues incurred with his rhetorical tools.

And you can add Alan Greenspan and David Stockman to Emeritus' list of libertarian heretics.

P.S. I think Mankiw called the notion "snake oil".
 
All I'm rebutting is the claim that "tax cuts don't pay for themselves". Sometimes they do (and have). Situation-specific details are crucial. The most important details: What's the present tax rate, and how long are you willing to wait?

Laffer's curve in generic form has no units. Situation-specific curves (with units) are always subject to lots of debate due to the underlying assumptions. View 'em with suspicion, but the underlying theory is well accepted. Does anyone think a 99% rate of taxation would produce more government revenue after 5 years than a 30% rate?

I think that Russian communism was a trial of that.

Ha
 
All I'm rebutting is the claim that "tax cuts don't pay for themselves". Sometimes they do (and have). Situation-specific details are crucial. The most important details: What's the present tax rate, and how long are you willing to wait?

Laffer's curve in generic form has no units. Situation-specific curves (with units) are always subject to lots of debate due to the underlying assumptions. View 'em with suspicion, but the underlying theory is well accepted. Does anyone think a 99% rate of taxation would produce more government revenue after 5 years than a 30% rate?

I don't think anyone disagrees that rates above a certain level are counter productive. But remember also we're not talking about a flat tax.

Marginal rates were as high as 90% during what I think was the greatest economic expansion in our history. I was around for some of it and don't recall any inordinate number of blood transfusions taking place. :)
 
Marginal rates were as high as 90% during what I think was the greatest economic expansion in our history. I was around for some of it and don't recall any inordinate number of blood transfusions taking place. :)
Well, the last time the top bracket was above 90% was in 1963. President Kennedy recognized the damage being caused and pushed a cut in rates (the top rate was reduced from 91% to 70% by 1965)

Our true choice is not between tax reduction, on the one hand, and the avoidance of large Federal deficits on the other. It is increasingly clear that no matter what party is in power, so long as our national security needs keep rising, an economy hampered by restrictive tax rates will never produce enough revenues to balance our budget just as it will never produce enough jobs or enough profits… In short, it is a paradoxical truth that tax rates are too high today and tax revenues are too low and the soundest way to raise the revenues in the long run is to cut the rates now.
- President John F. Kennedy
reccon09.jpg


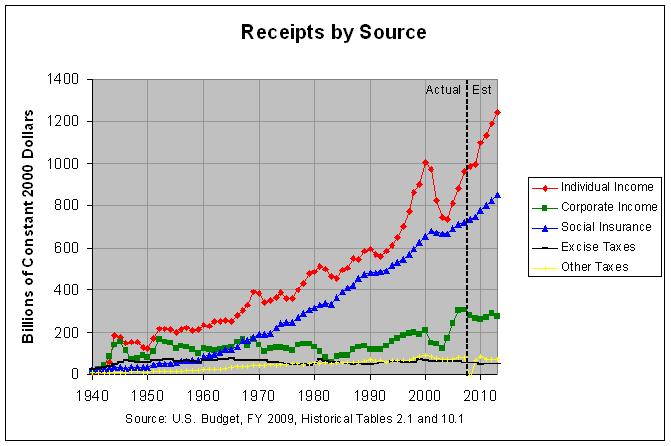
There was an increase in the slope of the revenues from the individual income tax beginning in 1965. That's not to say that the tax cuts caused it, of course.

And the slope of the revenue line increases after the Reagan tax cuts of 1984, but that's no proof that these cuts caused increased economic activity and more tax revenues.

There was another, probably coincidental, spike in revenues and continued upsurge after the "Bush tax cuts" of 2003. Again, that's not proof that the tax cuts caused it.
 
I find it difficult to look at past tax rate, high or low, and draw conclusion that similar rates would do X today. The tax code today is a far cry from the tax code of the Kennedy or even Reagan era. Comparing a tax rate with out the accompanying deductions and exemptions, imo, does not work. Like wise comparing the tax rate without taking into consideration spending, and the status of government debt would appear to also be flawed.
 
I didn't mean to imply that either of you said that policy should be based on this (neither did). I was asking if you think we should base policy on this, otherwise - why bring it up? And why define it in terms of race, when (as samclem reminded us) it is probably more appropriate to say that people with low LE would be disproportionately affected - generally the poor, people with medical conditions, poor genes, addiction or other risky behaviors, or bad lifestyle choices (addiction may not be a "choice").
-ERD50

I have stated very clearly that SS includes both an earned component and a welfare component. I then said it is unfair only to tax the working incomes up to 106,000 for the welfare component. If social welfare is a good idea it should be paid for by all sources of tax revenue

Whether the welfare component is a good idea is a totally different question

I further agree that how you calculate the earned component in any specific case is very complex. Its easy for the group as a whole but very hard for any individual. This makes inter racial comparisons harder. however the effect on distinct racial or gender groups of any given change is also very easy to analyze
 
I have stated very clearly that SS includes both an earned component and a welfare component.

If you refer to this post, (post #7 of this thread) , I've read it three times, and I don't find it clear at all.

I guess you define the spousal benefit as a welfare component since there is no explicit calculation for the worker's contribution for that benefit. Under equal situations, someone who lives/dies without a spouse pays the same into SS as someone who dies and has payments from SS to the spouse.

the welfare components are "detached" from the earnings i.e. they are calculated based on the earnings but no taxes are paid to support them. In particular there are no taxes collected to support the spousal benefit.

But I could just as easily (and more simply, queue Ockam) say that *everyone* paid for the spousal benefit - it was averaged into the payments we have all made since it can't be determined ahead of time. If I don't have anyone to collect the payments, that also means I didn't need the payments. SS is a form of insurance - I don't get to tell my insurance company that I want some money back because my house never burned down.

At any rate, the spousal benefit is tied to earnings, so that doesn't even seem like a correct (let alone clear) example. Since I was taxed on earnings, and the benefits are paid based on earnings, how can anyone say that no taxes were paid for the benefit? I see it all based on averages - we all pay, and some collect. So we pay less on average since not everyone collects.


And if:
the welfare components are "detached" from the earnings

how is it possibly determined that:

The entire welfare component of social security is paid for by middle income workers.
?

Since we define "middle income workers" by their earnings?


Judging by the questions and comments that followed that post, I don't seem to be alone as to the perceived clearness of your clarity.

-ERD50
 
If you refer to this post, (post #7 of this thread) , I've read it three times, and I don't find it clear at all.

I guess you define the spousal benefit as a welfare component since there is no explicit calculation for the worker's contribution for that benefit. Under equal situations, someone who lives/dies without a spouse pays the same into SS as someone who dies and has payments from SS to the spouse.


But I could just as easily (and more simply, queue Ockam) say that *everyone* paid for the spousal benefit - it was averaged into the payments we have all made since it can't be determined ahead of time. If I don't have anyone to collect the payments, that also means I didn't need the payments. SS is a form of insurance - I don't get to tell my insurance company that I want some money back because my house never burned down.

At any rate, the spousal benefit is tied to earnings, so that doesn't even seem like a correct (let alone clear) example. Since I was taxed on earnings, and the benefits are paid based on earnings, how can anyone say that no taxes were paid for the benefit? I see it all based on averages - we all pay, and some collect. So we pay less on average since not everyone collects.
-ERD50

I am sorry if the concept is difficult but I will try again

1) "tied to earnings" is a meaningless concept. The spousal benefit is calculated from earnings but nothing about the taxes paid funded the benefit. You could calculated it from anything and its still welfare eg. if the spousal benefit was 1000 per month regardless of earnings, it would be no different from the current system of half the calculated benefit. Its still welfare not funded from earnings.

2) Similarly benefits for children are "calculated' from earnings but nothing about the individual taxes paid funded the benefits.

3) Everyone paying means also that it is not funded by individual earrings.
Everyone pays taxes if we give some people money form those taxes, just because they need it or we like them its not an earned benefit.

What pays for social security is the poor return on tax payments for the dual income and upper social security wage group. The reason ifor the poor return is the need to fund the welfare payments.

The disability payments actually meet your idea of the risk insurance model. But the spousal payment do not since they are disallowed for people where both spouses earn benefits.
 
I guess you define the spousal benefit as a welfare component since there is no explicit calculation for the worker's contribution for that benefit. Under equal situations, someone who lives/dies without a spouse pays the same into SS as someone who dies and has payments from SS to the spouse.

It might be a matter of perspective.

If we view SS as earned by/paid to individuals (an individual pays SS and earns an entitlement, which is based on the individual's earnings), then checks to spouses and kids might be seen as welfare ("these other individuals didn't earn their entitlements)

If we view SS as earned by/paid to families, then the checks to spouses and kids are not welfare, as these individuals are also part of the family unit. Some families are small (one person) some are bigger, but this is group insurance so the "rates" are the same.

As it happens, in this government program we apparently pay as individuals but can receive some benefits as a family unit, which may be where the confusion comes from.

Of course, there's no easily identifiable "welfare" component, this is just an invented construct. The SS program is a two-axis wealth transfer mechanism: From the young to the old, and from the wealthy to the poor. The gradients across these axes are smooth without readily identifiable "components."
 
Of course, there's no easily identifiable "welfare" component, this is just an invented construct. The SS program is a two-axis wealth transfer mechanism: From the young to the old, and from the wealthy to the poor. The gradients across these axes are smooth without readily identifiable "components."

+1
 
As it happens, in this government program we apparently pay as individuals but can receive some benefits as a family unit, which may be where the confusion comes from.

Social Security is not a retirement program for workers it is a family-based economic security program. Therefore, it has disability and death benefits components as well.

I think of it as an insurance policy and as such I think it will be vitally important for the baby boomers coming up to retirement who have seen their retirement savings hit by the recent downturn. That FDR guy was pretty smart.
 
Social Security is not a retirement program for workers it is a family-based economic security program.
Yes and no. If SS were exclusively based on the family unit, then the annual caps would be based on family income. They ain't.

The tax is collected against individual pay, but benefits are paid to family units. That's the cause of some confusion.
That FDR guy was pretty smart.
Brilliant. We're still finding the ticking timebombs he and his helpers sprinkled around.
 
especially only when 51% of adult males were expected to reach retirement age when SS was put in place.

I had the time today to do some numbers so here they are.

A group of males aged 21 in 1940 could expect to live an average of 38.6 years before 65. (Some would live exactly 44 years, but others would die before 65 and pull the average down.) They would live an average of 7.25 years after age 65. This gives a ratio of "years paying taxes" / "years receiving benefits" of 5.3.

If we still had a retirement age of 65, the corresponding numbers for 2010 would be 42.5 years of work, 13.25 years of retirement, and a ratio of 3.2

In order to get back to the ratio of 5.3 in 1940, we'd need to have males retire at 71.

Now that we have lots of women working, we would also have to recognize that to get the 5.3 ratio for females, we'd need to set their retirement age at 74.

So that's a rough measure of the extent that longevity alone has impacted SS financing. Birth rates have also changed significantly, and they have another big impact.

[ I'm using the "period" tables here. List of Tables Maybe "cohort" tables would be more appropriate. ]
 
In order to get back to the ratio of 5.3 in 1940, we'd need to have males retire at 71.

Now that we have lots of women working, we would also have to recognize that to get the 5.3 ratio for females, we'd need to set their retirement age at 74.
Even if people had the health and stamina to work until that age, the impact on the unemployment rate would be horrific.
 
I had the time today to do some numbers so here they are.

A group of males aged 21 in 1940 could expect to live an average of 38.6 years before 65. (Some would live exactly 44 years, but others would die before 65 and pull the average down.) They would live an average of 7.25 years after age 65. This gives a ratio of "years paying taxes" / "years receiving benefits" of 5.3.

If we still had a retirement age of 65, the corresponding numbers for 2010 would be 42.5 years of work, 13.25 years of retirement, and a ratio of 3.2

In order to get back to the ratio of 5.3 in 1940, we'd need to have males retire at 71.

Now that we have lots of women working, we would also have to recognize that to get the 5.3 ratio for females, we'd need to set their retirement age at 74.

So that's a rough measure of the extent that longevity alone has impacted SS financing. Birth rates have also changed significantly, and they have another big impact.

[ I'm using the "period" tables here. List of Tables Maybe "cohort" tables would be more appropriate. ]

I hadn't thought of this before but since you bring it up, did you consider that there are many more households today with two FICA contributors with much smaller families than there were in 1940? Have you also considered whether/ how the change in immigration (1965) policy has impacted this?

I'm certainly willing to accept actuarial science as a means of setting a contribution rate that will sustain the program. However I strongly object to the policy of undermining the program by spending its surplus on tax cuts.
 
I hadn't thought of this before but since you bring it up, did you consider that
1) there are many more households today with two FICA contributors with
2) much smaller families than there were in 1940?
3) Have you also considered whether/ how the change in immigration (1965) policy has impacted this?

I'm certainly willing to accept actuarial science as a means of setting a contribution rate that will sustain the program.

4) However I strongly object to the policy of undermining the program by spending its surplus on tax cuts.

I added the numbers

1) AFAIK, the increase in wives in SS covered jobs has helped SS finances. First, when they were entering the workforce they added to the paygo revenue and are partially responsible for the program running the surplus that it did. In the long run, they reduce the cost of spousal benefits, improving the tax/benefit ratio, so they help there, too.

2) I mentioned birth rates as a big deal. In the simplest terms, the WWII generation had 3 children per couple, the boomers had 2. If nothing else changed, either the boomers would have to settle for 2/3 the benefits that their parents got, or the boomers' kids will have to pay 3/2 = 150% of the taxes their parents paid. (Note that this impacts all retirement programs, not just SS.)

3) I've never looked at that. It seems that if legal immigrants come as young workers they impact the system just like births - more people paying taxes today and more receiving benefits in the future. If they come late in their working careers they may get a slightly better deal than workers who were here for a lifetime due to the skewed benefit formula.

Many illegal immigrants pay SS taxes but can't legally get benefits. So they are a net plus. The SS actuaries have gone back and forth in their projections. In some years they have assumed that illegal workers would eventually get some sort of amnesty and hence would get benefits. In other years, they've assumed no future benefits. I'd guess the current projections use the second assumption, but I haven't checked.

4) I'll agree with that.
 
However I strongly object to the policy of undermining the program by spending its surplus on tax cuts.
Revenue comes from taxes and spending is spending. Exactly how does one "spend" on tax cuts?
 
Even if people had the health and stamina to work until that age, the impact on the unemployment rate would be horrific.

You've said this before and I've never responded. You're assuming that the number of jobs is fixed so more willing workers means more unemployment. Yet, the US has many more workers today than it did 100 years ago, and most of them have jobs.

I'd say the number of jobs is independent of the number of workers in the short run, but very dependent on the number of workers in the long run.

In the short run, an employer isn't going to suddenly hire more people just because the factory down the street closed and he now has many more applicants for jobs.

But there's a feedback mechanism where a slow increase in the number of workers puts a little downward pressure on wages, resulting in slightly higher profits per worker, leading to a few more job openings, leading to more people working and producing and spending, leading to more demand for products, leading to more job openings, etc. It's worked for the US for a very long time. Automation meant fewer workers were needed to produce a widget, but we've always employed those freed up workers producing more stuff other than widgets because we've always wanted more stuff.

So a sudden increase in the SS retirement age could increase unemployment short term, but a gradual increase shouldn't.

(I have a concern that we have a class of workers who've suddenly found new global competitors, and we're in the "short run" relative to those workers. That is confusing the situation right now.)
 
Back
Top Bottom