Rick Ferri's newest 30 yr return forecast by asset class

Midpack

Give me a museum and I'll fill it. (Picasso) Give me a forum ...
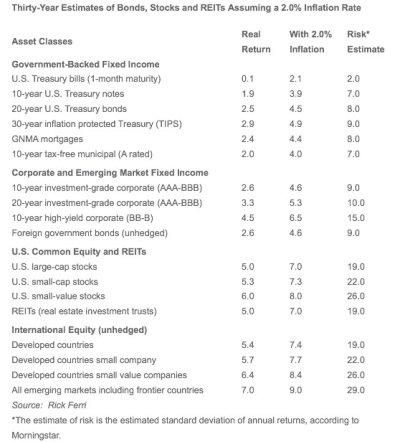
Joined
Jan 21, 2008
Messages
21,365
Location
NC

Attachments

  • image.jpg
    image.jpg
    90.2 KB · Views: 120
Thanks for the info. I hope Rick Ferri is right, his estimates for returns are a bit more than I'm planning on.
 
Thanks for the info. I hope Rick Ferri is right, his estimates for returns are a bit more than I'm planning on.
Me too on both counts frankly...
 
Really? A 30 YEAR return forecast, by asset class?

"Hey Bubba, hold my beer and watch me pull a rabbit outa my a**"

I guess this is why he is a successful and respected figure and I have trouble knowing what I'm going to have for lunch next week.
 
Nice high expected returns!

But, but, but, look at the high standard deviations in the 3rd column. That's the caveat.

Take a look at US large cap with 7% expected nominal return and 19% standard deviation. Large cap US practically means S&P 500. Using Gaussian distribution, that is saying that there's 50/50 chance that the nominal return will be within -5.7% to 19.7%.
 
Last edited:
Nice high expected returns!

But, but, but, look at the high standard deviations in the 3rd column. That's the caveat.

Take a look at US large cap with 7% expected nominal return and 19% standard deviation. Large cap US practically means S&P 500. Using Gaussian distribution, that is saying that there's 50/50 chance that the nominal return will be within -5.7% to 19.7%.
I would think the "Risk Estimate" means the spread in annual returns, i.e. you can still get that real return estimate for 30 years but will have to accept a certain risk level over each year.

Then there is the risk that none of this table works out at all. For me at age 65, there is the risk that I'm not around in 30 years but that I am around for a far worse or better outcome.

To be fair, it's a pretty balanced article. He says to use this info for long term AA purposes, but I bet a lot of readers will just think about 2014 returns. That's my primary focus. :facepalm::):confused:;)
 
I would think the "Risk Estimate" means the spread in annual returns, i.e. you can still get that real return estimate for 30 years but will have to accept a certain risk level over each year...
Yes, that's what the standard deviation means.

Again, assuming theoretical Gaussian distribution which everybody does because nobody came up with anything better, the chance of having a yearly return for S&P 500 between -12% (7%-19%) and +26% (7%+19%) is 68% for +/- one standard deviation.

The 7% is the average nominal return, but averaged over how long? Over the past 13 years since 2000, the Dow would be at 25,000 if it followed this average.

There's theory, and then there's real life...
 
Last edited:
Nice high expected returns!

But, but, but, look at the high standard deviations in the 3rd column. That's the caveat.

Take a look at US large cap with 7% expected nominal return and 19% standard deviation. Large cap US practically means S&P 500. Using Gaussian distribution, that is saying that there's 50/50 chance that the nominal return will be within -5.7% to 19.7%.

If you are talking the S&P 500 here is a web site that allows one to select any period from 1871 forward and see what the return would be (sort of a piece of what firecalc does). It shows the s&P 500 over that period to have returned an inflation adjusted 6.86 annual return with a standard deviation of about 18%.
 
Really? A 30 YEAR return forecast, by asset class?

"Hey Bubba, hold my beer and watch me pull a rabbit outa my a**"

I guess this is why he is a successful and respected figure and I have trouble knowing what I'm going to have for lunch next week.

+1
Saw this elsewhere and was mad I even looked at it. I can think of no better way to blow your credibility than to do a forecast like this. Look back at 30 years ago, could anyone have foreseen the rise/crash of Japan? The subsequent rise of China?
 
+1
Look back at 30 years ago, could anyone have foreseen the rise/crash of Japan? The subsequent rise of China?

Sure, I know someone. Harry Hindsight. I've never known him to be wrong.
 
If you are talking the S&P 500 here is a web site that allows one to select any period from 1871 forward and see what the return would be (sort of a piece of what firecalc does). It shows the s&P 500 over that period to have returned an inflation adjusted 6.86 annual return with a standard deviation of about 18%.

The above numbers are not out-of-line with what Ferri published. So, what's new in Ferri's numbers?

What is of interest to me is that experts maintain that yearly returns are random and have no correlation from year to year. Yet, we have almost 20 years of excellent stock returns in the period of 1980-2000, and terrible periods in the past. It appears to me that stock returns are not independent random events, but a product of the business cycles which in turn are shaped by world-wide political events.
 
If this sort of thing is of interest, for a small (well, moderate) fee I will provide estimates of returns for the next 50 years (a 67% improvement over Ferri's numbers). :LOL:
 
It's funny, we all have to base our plans on something including some long term returns, but no one is credible who tries. Makes sense...
 
That table appears to be based on historical rates of return, plus recency, plus return-to-average. It's OK but how many want to bet on the 30 year return-to-average?
 
It's OK but how many want to bet on the 30 year return-to-average?
"Return-to-average" meaning "historic PE's (for equities)" or "historic returns"? I'd say that we'll see a return to historical average PEs (or similar "relative value" measure), but I'm far less certain that we'll see a return to average historic returns. So, I'm expecting lower-than-average share price appreciation going forward.
What I'd really like is to find an developing/emerging market country that has all the favorable factors the US had in the early 20th Century. Natural resources, favorable "neighborhood", commitment to the rule of law and individual property rights, etc.
 
I am confused by some of his numbers. The 30-year real return on TIPS is currently expected to be <1.5% by the market, so I don't understand how he gets to 2.9%.
 
The 30-year real return on TIPS is currently expected to be <1.5% by the market, so I don't understand how he gets to 2.9%.

Is it possible we're talking about the difference between:
- anticipated near-term return on 30 year TIPS (found as the difference between present return of 30 year TIPS minus the return of another riskless asset).
and
- The anticipated return of 30 year TIPS over the next 30 years (which I think is what Ferri is giving us).
 
I am confused by some of his numbers. The 30-year real return on TIPS is currently expected to be <1.5% by the market, so I don't understand how he gets to 2.9%.
My best guess would be he is saying if you bought 30 year TIPS incrementally over the a long period?

The 20 year Treasury real return is 2.4% but the current 20 yr TIPS is 1.1%. He is saying 2.5% for the 20 yr TIPS. Maybe an averaging in over the next 10 years?

If you are youngish this stuff might make sense as a general approach to AA.
 
That table appears to be based on historical rates of return, plus recency, plus return-to-average. It's OK but how many want to bet on the 30 year return-to-average?
Well, I am quite certain I will not be around 30 years from now. What I care about is the prediction for the next 10, 15 years. Wait! I care more about the prediction of my own lifespan. And nobody can tell me that.

I am still curious to see what people predict, but I am not going to put any of this into any spreadsheet, of which I have none.
 
Whoa! No prediction spreadsheet? And here I thought all the smart people had one. ;)
 
I prefer to stay around 3.5%WR, then to follow what I state in my signature line. Spreadsheet is a wish list to me. I prefer to use contemporaneous data.

See below. :cool:
 
Last edited:
How do people use these predictions?

I can compute my weighted expected return and see that it is greater than my planned withdrawal rate, but I'm not really sure what else I should do with these numbers.
 
How do people use these predictions?

I can compute my weighted expected return and see that it is greater than my planned withdrawal rate, but I'm not really sure what else I should do with these numbers.


I did the same looked at the averages and applied my current AA for each asset class. This gave me an expected average return, and because I am sure that numbers are 100% accurate I subtracted 2.5% for inflation. Divide the number 12 and plan and spend that much each and every month.

Ok actually I did nothing of the sort, but seeing the higher equity returns makes me feel better. :D
 
I am not sure about the long term 2% inflation rate. Looking at inflation swap market the 30 year inflation break-even is around 2.81%
 
Well, I am quite certain I will not be around 30 years from now.

While I suppose it is possible that I'll be around 30 years from now a big question mark is whether I'll want to be.

In the meantime I'll wager that one guy's crystal ball is just as good as anyone else's for that time frame.
 
Back
Top Bottom