Risk Tolerance Quantified?

Midpack

Give me a museum and I'll fill it. (Picasso) Give me a forum ...
Joined
Jan 21, 2008
Messages
21,353
Location
NC
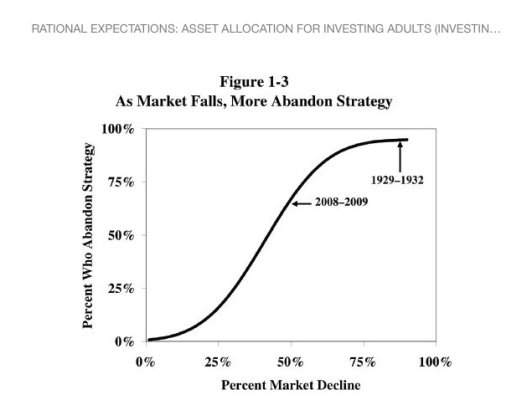
In the midst of reading Bernstein's Rational Expectations and found this graph interesting. He doesn't disclose where his numbers come from (that I could see), but his conceptual read on the relationship between investors who fully understand their risk tolerance vs market drops, and those who "cave" on the way down. Everyone thinks they understand their personal risk tolerance, until they don't...

Note it's independent of AA, maybe suggesting even investors with lower equity allocations may bail when the going gets rough(er than normal).

It's well documented that he was surprised, even shocked by the behavior of his own presumably sophisticated well-to-do clients during the 2008-09 meltdown. Here that is quantified?
 

Attachments

  • image.jpg
    image.jpg
    41 KB · Views: 53
Last edited:
I haven't read the book yet, but this doesn't look like it's based on real data. Or maybe it's curve fit from only a few points.
 
I haven't read the book yet, but this doesn't look like it's based on real data. Or maybe it's curve fit from only a few points.
Agreed. But I'd think the y-axis numbers are his best estimates, and he ought to have a pretty good handle on same. IME Bernstein is very knowledgeable when it comes to quantifying his conclusions.
 
Does he define "Abandon Strategy"? Out of fear, I technically (and temporarily) abandoned my strategy when I rebalanced (from bonds into stocks) in July 2009. Instead of moving 5% of my portfolio, I only moved half of that amount. But this is far from the extreme, which would be bailing out of stocks completely. Bernstein's numbers are meaningless without a more precise definition.
 
I very much doubt that this quantifies anything. It illustrates something that must have a lot of truth. If a lot of money did not run from rapidly descending markets, markets would not rapidly descend.

It is an attempt to create a narrative around what he is addressing with his new book.

Ha
 
Last edited:
It looks like just a theoretical S-curve used to illustrate a general point.
 
The 2008 crash had a profound effect on Bernstein. 70% of his wealthy and supposedly "battle-hardened" clients capitulated (sold their stock allocations at or near the bottom).

He did not expect this.
 
Last edited:
It looks like just a theoretical S-curve used to illustrate a general point.
Clearly to illustrate a general point, but why put numbers on the axes with no basis whatsover? With no basis at all, I'd think he might do something like this time honored format below.

Just an observation, no biggie. Anyone ever seen an attempt to quantify same?
 

Attachments

  • risk-return.gif
    risk-return.gif
    13.8 KB · Views: 223
The 2008 crash had a profound effect on Bernstein. 70% of his wealthy and supposedly "battle-hardened" clients capitulated (sold their stock allocations at or near the bottom).

He did not expect this.
I hadn't heard that number, but it's consistent with his chart...
 
@galeno, got a link for that statement about 70% capitulated?

Even Vanguard described that very few capitulated when they look at Vanguard accounts. Let me go find a link for that notion.
 
Clearly to illustrate a general point, but why put numbers on the axes with no basis whatsover? With no basis at all, I'd think he might do something like this time honored format below.

Agree it's very misleading to have specific numbers if he's just trying to say he thinks the response is sigmoidal. Even worse is labeling specific points on the curve corresponding to events.

Just an observation, no biggie. Anyone ever seen an attempt to quantify same?

I guess all the big mutual fund companies like fidelity vanguard must have this information. Too bad it isn't available to academics.
 
Investors are irrational, whether they admit it or not. What good would quantifying one's risk tolerance do? Just so you could fool yourself into thinking you can tolerate more risk than you actually can? Bernstein himself states investors must go through at least a couple of bear markets before they really know their true risk tolerance (maybe).

I agree with the above that Bernstein was suprised at how many of his clients misjudged their risk tolerance during the 2008 crisis. His writings have changed since that time, getting more conservative. Recency bias? Who knows?

Personally, I could stand a 50% equity drop based on current AA. After that, I just might start losing sleep, maybe stock up on guns, gold, and cat food...
 
Personally, I could stand a 50% equity drop based on current AA. After that, I just might start losing sleep, maybe stock up on guns, gold, and cat food...

Yeah me too and that's basically what the DJIA did from 2007-2009 IIRC, went from 14k down to 6.5k. The S&P was just as bad, and that's a pretty big drop. I think I was down around 30% overall during that period and I could handle that now with a 60/40 AA, but man that's going to make for some nervous times when you get that far down. I haven't gone back and looked at the posts then but I'm sure it was tough to ride through for the vets here.

The bigger issue is the fear that there is no bottom, that you're going to be wiped out because of some sort of financial system collapse. It's not so much that we could have another Depression because the government is the last resort as in the Great Recession - it could be hackers, terrorism, pandemic etc. you just never know. Have to have faith that these types of black swans don't happen or are mitigated with intervention because if we get that low all bets are off anyway, doesn't matter what you hold.
 
Last edited:
The 2008 crash had a profound effect on Bernstein. 70% of his wealthy and supposedly "battle-hardened" clients capitulated (sold their stock allocations at or near the bottom).

He did not expect this.
I heard from a broker too that many of his clients sold at the bottom. For me the strange thing is that I know a lot of people who have been in the market a long time, mostly in their 60s, most with substantial assets, and don't know a single one who sold (or said they were selling) during the panic. We were all scared and worried but not selling. There must be some metric or demographic that describes panic sellers vs. those that can maintain some optimism about the future. Was it the news sources they were listening too, the friends they associated with, their years in the market, political leanings, educational level, job security, profession, what?

I wonder if there is any predictor of those who will panic and those who wont. Has anybody seen anything about this?
 
I stopped watching Mr Market and started watching more football. I think it helped having been thru a few downturns since 1966 my thick head finally grasped index funds, rebalancing and above all - 'stay the course'.

In 2006 I had gone 'full auto' with Vanguard Target Retirement 2015 as the big dog. A tad grippy but I rode thru the little dip.

heh heh heh - hindsight being a wonderful thing I can brag now and forget how nerve wracking it was at times. Oh and the Saints finally won a Superbowl after I waited since 1974. ;)

P.S. Also cut expenses/withdrawal rate during the downturn.
 
Last edited:
I wonder if there is any predictor of those who will panic and those who wont. Has anybody seen anything about this?
Maybe the time that the investor can stand holding his hand in a bucket of ice water?

Ha
 
I was reading a WSJ article recently and it referenced a Mike Tyson quote "Everybody has a plan—until they get punched in the mouth" and I guess the same could be said for many equity investors.

FWIW, I stayed the course in 2008 but didn't have the courage or conviction to buy when my AA was screaming at me to buy. OTOH, I know of many who blinked and never got back in and missed out on the big rally.
 
Most investors have no clear picture of what happened in 1932.

Some think 2008-2009 was the test case. But was it really?
 
I personally know some very smart people who sold at the bottom and never went back. I think when someone invests trying to make a 7-8% return and sees half their money gone, it is human nature to abandon the whole idea.

I think it takes a lot of reading, talking and understanding to really internalize, emotionally, what the stock market is and represents to the extent that you can feel confident that (a) these fluctuations are normal and (b) it's almost certainly going to recover in 5-10 years.

Five to ten years when you are older can exceed your life expectancy. Plus in absolute dollars the losses of money accumulated over a lifetime can be huge, and no longer made up by expending a bit more human capital.
 
Last edited by a moderator:
Five to ten years when you are older can exceed your life expectancy. Plus in absolute dollars the losses of money accumulated over a lifetime can be huge, and no longer made up by expending a bit more human capital.

My adviser is arguing that if you can, the best strategy is to keep an amount equal to 5-8 years of living expenses (whatever you think the longest duration of a downturn is likely to be) in cash and short bonds, the rest in equities. His reasoning is that the real investing goal is to avoid permanent loss of capital not to avoid paper losses. The plan would be to only refresh the cash/bond buffer when I can do so by selling equities at a gain and having this buffer should mean I never have to sell at a loss.

Historically he's about right, especially if I dollar cost average to that arrangement over 5 years (just to be sure today isn't June of 2007 :facepalm:).

I'm still trying to digest that way of looking at things after years of being a "Random Walk/Couch Potato" oriented thinker.
 
Today's markets worldwide are very heavily manipulated

So one really cannot have much confidence that the past is prologue. As long as the Fed can keep all those balls in the air, likely we will charge on to higher and higher levels. When some internal or eternal event makes people doubt that this game can be continued, it will be over once more, at least for an unknown period. Remember back in 2007 when some brilliant banker (I think it was John Thain) said as long as the music keeps playing, we've got to keep dancing. The corollary is as soon as that music seems to be stopping, you had better run for your life.

Nevertheless, heavy duty rebalancing is expensive, especially if much of your equity exposure is in a taxable account. A very large amount of stock has to be sold, just to move the exposure down a couple percent. When you watch your tax rising, your Medicare premium rising or your ACA subsidy falling or disappearing, and still you see slight change in your allocation, it gets daunting.

My equity allocation is now in low 60%, after quite a bit of selling. I would like to be no higher than 50-50, but this is not going to happen. If my equities were in tax deferred accounts or Roths, I might go toward 20:80.

Ha
 
Last edited:
...
My equity allocation is now in low 60%, after quite a bit of selling. I would like to be no higher than 50-50, but this is not going to happen. If my equities were in tax deferred accounts or Roths, I might go toward 20:80.
Ha
I am curious, would you want to transition into a bond heavy AA like this because of your age or because of the market?
 
Back
Top Bottom