S&P 500 is not diverse

I'd say there's not really a significant enough difference to drive one way over another....
I am in Total Market Index and do use the S&P Index as one benchmark.
 
The point of using SP500 is to be broad. The point of using a sector fund is to be narrow.
I might even say use SP500 to be broader than using a single sector like Energy.
Then it would follow that one might use Total US Stock Market to be broader than using SP500.
[emoji56]
 
https://www.thebalance.com/total-stock-market-vs-sandp-500-2466403

In simpler terms, a total stock market fund does not really invest in the total stock market in a literal sense. A better descriptor would be "broad large-cap stock index." Many investors make the mistake of buying a total stock market fund thinking that they have a diversified mix of large-cap stocks, mid-cap stocks and small-cap stocks in one fund. This is not true.
Where investors can get confused and/or make mistakes, is that many total stock market index funds use the Wilshire 5000 Index or the Russell 3000 Index as the benchmark or, as Morningstar labels it, the "best-fit index." However both of the "total stock market" indices are either mostly or completely comprised of large capitalization stocks, which makes them have a high correlation (R-squared) to the S&P 500 Index.

When you invest in total stock market index funds, you're not always getting a complete representation of the entire stock market. Therefore, the descriptor, "total stock market index," can be misleading. Both the Wilshire 5000 Index and the Russell 3000 Index cover a broad range of stocks.
 
Wow! Just when I was beginning to think that everything I read on the internet is true, this guy comes along. Ack!

The author says "... a total stock market fund does not really invest in the total stock market in a literal sense. " Actually, they do: Even the most cursory look at total market funds makes it obvious that what he says is untrue. For example, Morningstar says total US market fund VTSMX holds 3,580 US stocks. That is basically all of the investable stocks in the country. Total world market fund VTWAX holds 8,382. I have not personally counted but that sure sounds like every investable stock in the world.

The author's confusion may comes from his misunderstanding of cap-weighted funds. Or maybe just from ignorance. It is hard to tell.

Total market funds almost always hold stocks on a cap weighted basis. So, "large cap" stocks will automatically predominate in dollar value within a fund. For example, on a cap weighted basis I have read that the S%P 500 comprises 80% of the US market. So the other 3,080 stocks that VTSMX holds will be the other 20% in dollar value. That is something quite different than the article claims.

"Total market" funds don't actually own every stock in the market. Specifically, VTSMX and VTSAX (Admiral shares) do not. This is what the prospectus says
The Fund employs an indexing investment approach designed to track the performance of the CRSP US Total Market Index, which represents approximately 100% of the investable U.S. stock market and includes large-, mid-, small-, and micro-cap stocks regularly traded on the New York Stock Exchange and Nasdaq. The Fund invests by sampling the Index, meaning that it holds a broadly diversified collection of securities that, in the aggregate, approximates the full Index in terms of key characteristics. These key characteristics include industry weightings and market capitalization, as well as certain financial measures, such as price/earnings ratio and dividend yield.

which is why this is listed as a principal risk

• Index sampling risk, which is the chance that the securities selected for the Fund, in the aggregate, will not provide investment performance matching that of the Fund‘s target index. Index sampling risk for the Fund is expected to be low.

See https://personal.vanguard.com/pub/Pdf/sp85.pdf?2210158506 at page 3.


Edit to Add: VTWAX works exactly the same way https://personal.vanguard.com/pub/Pdf/sp5028.pdf?2210151264 at page 2
 
Last edited:
"Total market" funds don't actually own every stock in the market. ...
Yes, that is pretty standard language. I think it is both a CYA and a holdover from prior years where sampling and tracking error were discussed more. AFIK it has always been in the fund prospectuses and I think in Olden Times sampling strategies were more common. Assuming Morningstar's numbers are correct, though, the two VG funds I mentioned are going far beyond sampling. The number of investable US stocks is often quoted at 3600, so I think holdings of 3,580 has to be pretty much everything. And 8,382 certainly looks like a number that would pick up all the investable stocks in the world.

But what if Morningstar is wrong? Sampling vs actual holdings really doesn't change anything if tracking errors are near zero, which they are. And it doesn't change the fact that the linked article is nonsense.
 
I'd say there's not really a significant enough difference to drive one way over another....
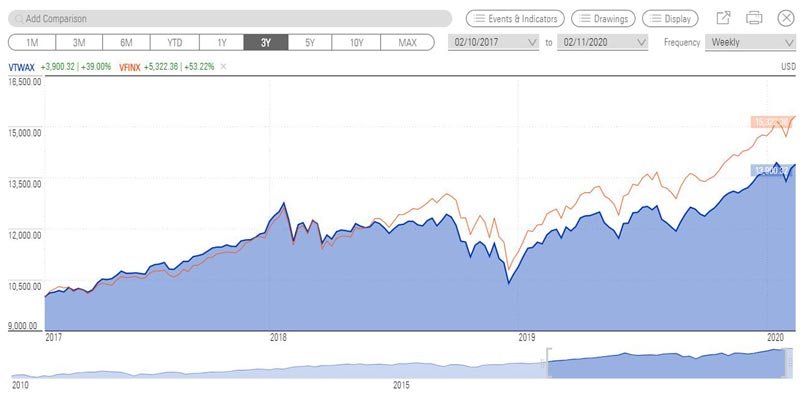
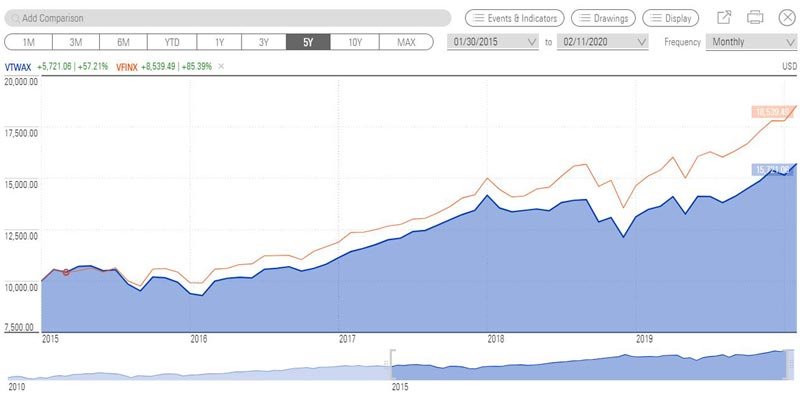
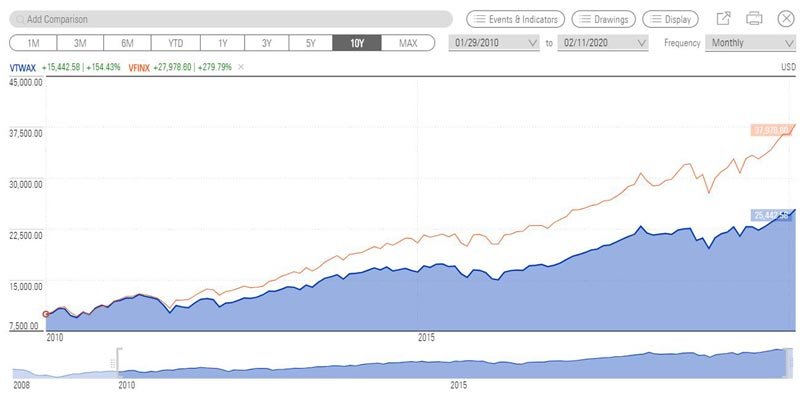
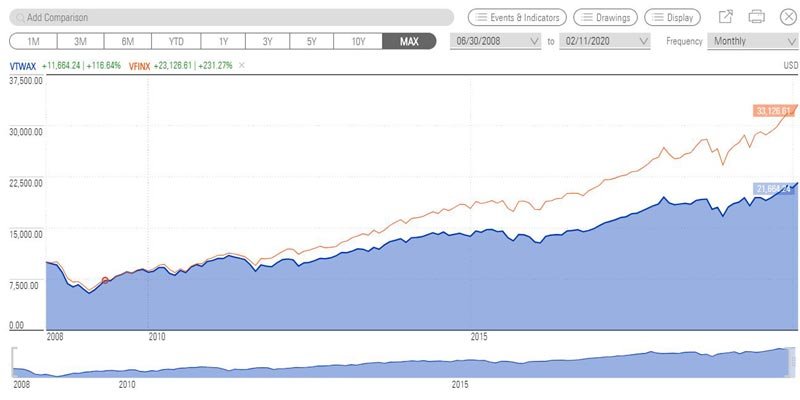
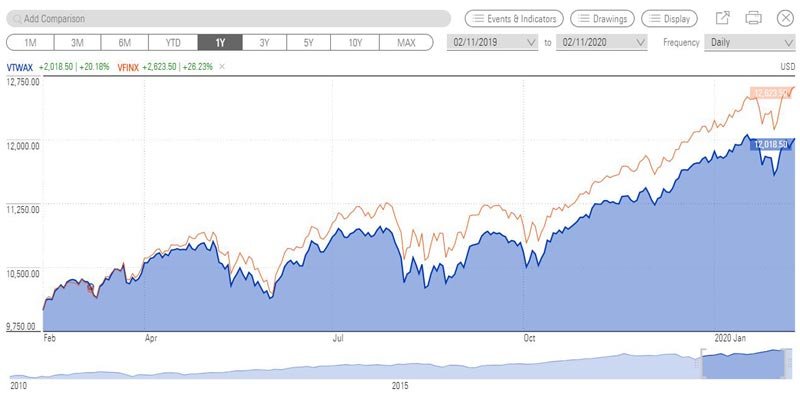
Here's a look at the Vanguard S&P500 index fund vs. the Vanguard Total World Stock Market index fund. Time periods are 1 year, 3 year, 5 year, 10 year, and since June 2008, so it includes the crash. I'd say there is a significant difference.

For example, $10,000 invested in the S&P500 index fund in June 2008 would have given you $33,127 today, whereas $10,000 invested in the Total World index fund would have given you $21,664 today. Do you think a 53% difference over 10 years is "not really significant one way or the other?"

Just in the past year the difference was $605, or 5%.


VTWAX-VFINX-1-Yr.jpg


VTWAX-VFINX-3-Yr.jpg


VTWAX-VFINX-5-Yr.jpg


VTWAX-VFINX-10-Yr.jpg


VTWAX-VFINX-Jun2008.jpg
 
I will continue to look for better confirmation, but this screener on the NASDAQ site implies that there are 6234 tradeable stocks in the US. (that probably includes ADRs).
 
I will continue to look for better confirmation, but this screener on the NASDAQ site implies that there are 6234 tradeable stocks in the US. (that probably includes ADRs).
I will be interested to hear. I have always understood the 3600 number to refer to the universe of stocks available to mutual funds. Or maybe it is the number that receive analyst attention. That would exclude, I think, penny stocks and the pink sheets. Maybe that is the discrepancy?
 
Here's a look at the Vanguard S&P500 index fund vs. the Vanguard Total World Stock Market index fund. Time periods are 1 year, 3 year, 5 year, 10 year, and since June 2008, so it includes the crash. I'd say there is a significant difference.

For example, $10,000 invested in the S&P500 index fund in June 2008 would have given you $33,127 today, whereas $10,000 invested in the Total World index fund would have given you $21,664 today. Do you think a 53% difference over 10 years is "not really significant one way or the other?"

Just in the past year the difference was $605, or 5%.


View attachment 33830


View attachment 33831


View attachment 33832


View attachment 33833


View attachment 33834

My comment was based on the graph that I presented, so yes, I stand by my statement. No SIGNIFICANT difference in that graphed comparison.

Your attachments are based on Total WORLD Market, and I didn't understand that to be the statement I was questioning, at least no one said TWM.
 
I will be interested to hear. I have always understood the 3600 number to refer to the universe of stocks available to mutual funds. Or maybe it is the number that receive analyst attention. That would exclude, I think, penny stocks and the pink sheets. Maybe that is the discrepancy?

The St. Louis Federal Reserve says that, as of 10/21/17, there were 13.3355 listed companies per million people in the US (a really odd statistic to tabulate).
https://fred.stlouisfed.org/series/DDOM01USA644NWDB. The census estimated that the US Population on 7/1/17 was 325.7 million. https://www.census.gov/newsroom/press-releases/2017/estimates-idaho.html. This implies that there were 4343 listed companies in the US at that time. I think it would be safe to assume that a number of them have different share classes, so the total number of tradeable stocks would be larger. Although, as you note, many could be micro-caps that trade only on the pink sheets.

This is an interesting question and I plan to research further.
 
... Your attachments are based on Total WORLD Market, and I didn't understand that to be the statement I was questioning, at least no one said TWM.
He chose TWM because for the last decade international stocks have been weaker than the US, so it makes the S&P look relatively stronger. No real news there. In the roughly the previous decade it was the other way around.

IMO your point that the S&P is not that much different than the total US market is roughly correct. It really cannot be any other way in recent history because the S&P market cap has been around 80% of the total cap. But AFIK there are no stone tablets stating that is an eternal truth. Hence, I still prefer betting on everything rather than betting on just the large cap sector. There is also the question of when/how/whether the S&P will regress to its mean. Same-o the US market vs the international market.
 
... This is an interesting question and I plan to research further.
After Sarbanes–Oxley there was a period where public companies were going private because of new burdensome reporting. That is certainly a factor in the Wilshire "5000" no longer being 5000. I'd think that was mostly over by your 2017 data point, tho.
 
My comment was based on the graph that I presented, so yes, I stand by my statement. No SIGNIFICANT difference in that graphed comparison.

Your attachments are based on Total WORLD Market, and I didn't understand that to be the statement I was questioning, at least no one said TWM.

You are correct that your graph shows VTSAX does not differ much from VFIAX as far as returns over the long haul. However, the total market fund being discussed in this thread was VTWAX, so that is the one I used in my comparison.
 
He chose TWM because for the last decade international stocks have been weaker than the US, so it makes the S&P look relatively stronger. No real news there. In the roughly the previous decade it was the other way around.

No, I chose VTWAX because that is the one you recommended and that is the one that was being discussed in this thread as the total stock market fund.
 
I am not in love with the VTWAX, as it does not fit our 2:1 ratio in favor of US equity.
 
Over some decades the SP500 has been hard to beat. It is the fund I measure other fund's performance against. I think the only reason to invest is to make money and as much money as is practical. This is not a morality game. And I can't stand to own assets that year after year under perform. And yes I've seen that Callan chart. :)

Falling in love with concepts can lead one down the wrong path. Some concepts I've left behind:

always have a portfolio with a little of this and a little of that
you have to own international stocks all of the time
there is a value premium that is sure to show up
there is a small cap premium that is sure to show up ... someday

My 2 cents.
 
Can't argue with you, since the Great Recession. However, as the article indicates, the decade of 2000 told a different tale for the S&P (-.95% annual gains vs., say, +6.3% annual gains for small & midcaps over the decade).
https://www.forbes.com/sites/advisor/2010/09/13/its-not-really-a-lost-decade/#cd2333a7cf81

I'm skeptical the S&P's outperformance will continue, so I have included since 1997 (smaller percentages) of foreign, emerging, small and mid cap, and health/biotech. I got hammered the first 3-4 years (1998-2001), but then the small/mids way overperformed the S&P beginning (I think) in 2002 and the tech crash. I understand these sectors will often underperform, as in this decade; but they outperformed in the prior decade. Them's the breaks.

What will you say if/when the S&P underperforms for the next decade? (I see no signs of this occurring soon, to argue for you).

Many investors allocate in a fixed in time way. I don't think that is bad and I'd be tar'd and feather'd if I said anything bad about that. :) Personally I have migrated to a fully flexible approach that allows for out performance of different asset classes i.e. momentum oriented.

So, for example between the two crashes of the 2000's I would be mostly in small caps, midcaps, and also small cap international. That is a backward simulation that does not match what I actually did then (rats). Currently I'm in the SP500 and large cap growth. This is all driven by some simple algorithms that I update with monthly data. But it boils down to a two index fund portfolio. I've been running something like this for the last 10 years.
 
Last edited:
Back
Top Bottom