Some Interesting Historical Data and Most Recent Shiller PE10

haha

Give me a museum and I'll fill it. (Picasso) Give me a forum ...
Joined
Apr 15, 2003
Messages
22,983
Location
Hooverville
As of the close on March 18, Shillers PE10 stood at 21.34. We have had a considerable rally since then, so it is higher now.

To help put this into perspective (probably not a very appealing task) here is some data about PE10 and subsequent returns, summarized by decile and by quartile.
Investment Postcards from Cape Town » US stock market returns – what is in store? » Print

But Ha, you say, Warren Buffet says he is "all in on America".

You be the judge!

I have sold any equities in retirement accounts, but still own a lot in taxable accounts on which I do not want to realize the gains. I posted the same thing in 2007, and I was sorry that I let the tax tail wag the investment dog. But that was after the damage had been done, and thus easy to feel.

Ha
 
I've calculated the same thing.

But I still don't understand the force that compels mean reversion either in the short, or long-term. Particularly when a 21x PE-10 has been the average over the past 30 years.

The whole idea behind the 10-year average was to smooth out the earnings cycle. But it looks like stocks are trading at 15x this year's earnings, which is pretty average. Are we already back to peak earnings? PE-10 says we are. But it doesn't feel to me that we should be, just one year removed from the Great Recession and with unemployment still near 10%.

I'm just not sure what to make of PE-10 saying we're really overvalued when current earnings look OK, and should have more room to the upside.
 
One of my favorite charts is market cap vs. GDP. Vanguard used to include it in their newsletters, and I had a copy of it on my office wall during the internet bubble. I was amazed at the strong feelings it produced. Engineers (who were probably 100% in JDS Uniphase or something like that) would see it and fly off the handle.

Here is an updated version.
3-19-10-Market-Cap-2.gif

The Big Picture » Blog Archive » Market Cap of NYSE + Nasdaq as a % GDP
 
I've calculated the same thing.

But I still don't understand the force that compels mean reversion either in the short, or long-term. Particularly when a 21x PE-10 has been the average over the past 30 years.

Mean reversion. Tobin's Q says it is a basic feature of a capitalist economy. It seems that it should be. Take a look at Triumph of the Optimists by Elroy Dimson. Whatever the reason, it does appear that for a very long time and in many different countries mean reversion has been demonstrated.

Regarding your point about the average PE10 for 30 years being 21, the first 20 years of that period were the all time mother of secular bulls. You don't get down from a mountain peak overnight.

The other thing I would say is that average=mean is not a very useful a statistic for this kind of data. As you can see in the article above, 21 is also the 90th decile!

Ha
 
One of my favorite charts is market cap vs. GDP. Vanguard used to include it in their newsletters, and I had a copy of it on my office wall during the internet bubble. I was amazed at the strong feelings it produced. Engineers (who were probably 100% in JDS Uniphase or something like that) would see it and fly off the handle.

Very interesting chart IP.

Ha
 
As you can see in the article above, 21 is also the 90th decile!

Yes, but I guess I think its meaningful that we've spent most of the past two decades in the 90th decile valuation. To the extent there is mean reversion, it matters to me as an investor whether we revert over the course of a couple of years, or over the business cycle, or over a generation, or over the life span of a country. Recent experience suggests we're more in the latter camp, than the former.

But my thoughts on mean reversion bear some further explanation. What I think we are measuring with PE 10 and the like are "risk premiums". Or, the amount of return an investor demands to engage in a risky activity. But risks change over time. As do costs. Investing in a generic stock in 2010 doesn't have the same risk profile, or cost involved, as it did in 1910. Why should average risk premiums be the same in these two periods? Or, said another way, why should risk premiums for a less risky and less costly investment today mirror those of a more risky and more costly era?

A simple thought experiment asks the question "Would you pay more or less for the same expected stream of business cash flow in 2010 or in 1910?" The answer is pretty clear, to me anyway. I'd pay more in 2010. Why? My costs are lower, both commission and bid/offer spreads. I have a whole host of legal protections, including an SEC that limits fraud. I have GAAP statements that are audited. I have easy, low cost, access to diversification which significantly reduces my risks. And looking over my shoulder I have sixty years of relative economic calm versus a pretty regular 10 to 15 year cycle of financial panic and depression in the 1800's and early 1900's.

That isn't to say the sky is the limit. I just don't think an average constructed over a period of 100+ years is necessarily all that informative, except in the extremes. And I don't see the justification for reverting to an average risk premium that prevailed in a period where investing was far more risky and costly. Now its certainly possible that all of the things that have reduced the risk and cost profile of investing today can be undone. But I think we're talking about changes that take place almost over geologic time, rather than a reasonable investment horizon. Which brings me back to my first point.
 
Yes, but I guess I think its meaningful that we've spent most of the past two decades in the 90th decile valuation. To the extent there is mean reversion, it matters to me as an investor whether we revert over the course of a couple of years, or over the business cycle, or over a generation, or over the life span of a country. Recent experience suggests we're more in the latter camp, than the former.

But my thoughts on mean reversion bear some further explanation. First of all, I think that what we are measuring with PE 10 and the like are "risk premiums". Or, the amount of return an investor demands to engage in a risky activity. But risks change over time. As do costs. Investing in a generic stock in 2010 doesn't have the same risk profile, or cost involved, as it did in 1910. Why should average risk premiums be the same in these two periods? Or, said another way, why should risk premiums for a less risky and less costly investment today mirror those of a more risky and more costly era?

That isn't to say the sky is the limit. I just don't think an average constructed over a period of 100+ years is necessarily all that informative, except in the extremes. Now its certainly possible that all of the things that have reduced the risk and cost profile of investing today (SEC, Fed, GAAP, mutual funds, greater liquidity, greater transparency, etc, etc) can be undone. But I think we're talking about changes that take place almost over geologic time, rather than a reasonable investment horizon. Which brings me back to my first point.
Yes; well I guess that is why there are markets!
 
Sure PE10 is enlightening however it doesn't include the effects of inflation, interest rates, and the costs of (borrowed) money. So while the PE10 stat is enlightening it doesn't tell the whole story. I wouldn't sell the family farm based on a PE10 reading.

We need to normalize the PE10 stats by an inflation rate stat to get a better handle on things. Sure PE10's were low in the 70's but inflation was at 10%+. When inflation dropped off the market took off.

The modified PE10 model, described in an article on Minyanville, takes into account additional variables like real and nominal interest rates, economic volatility, GDP growth, debt levels, book values and more.
JKC3.jpg
 
The modified PE10 model, described in an article on Minyanville, takes into account additional variables like real and nominal interest rates, economic volatility, GDP growth, debt levels, book values and more.
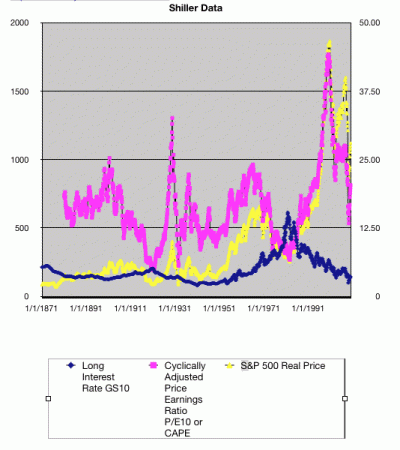
Interesting chart. I'll go read the article. In the meanwhile, here is a chart of Shiller's data from Irrational Exuberance. Note the S&P500 prices are inflation adjusted. He very kindly makes it available for download here.
http://www.econ.yale.edu/~shiller/data.htm
Shiller data.gif
 
He very kindly makes it available for download here.
http://www.econ.yale.edu/~shiller/data.htm

Yup, if you use his data to calculate a "line of best fit" on the PE 10 you'll see that it isn't a horizontal line at the historic average. But rather an upward sloping line. Current stock valuations lie just about right on top of that line. I've posted it before and if I feel ambitious I'll recreate it.
 
I would say that a PE10 of 20 with a 1% yield on cash and 4% on the 10-year T-note may be less "overvalued" than a PE10 of 15 with a 5% yield on cash and a 6% yield on the 10-year T-note.

The market may think an earnings yield of about 4.5% isn't bad compared to yields on everything else. If interest rates rise on "safer" investments and yield-starved income investors no longer have to take risks to get acceptable yield, *then* I don't think the market would sustain an earnings yield as low as 4.5%. But given the current alternatives...
 
All very interesting, Ha, but how do we make use of it? All it tells me is that I should not expect very good returns for the next ten years.

I am not sure that it tells me to change my asset allocation. If I move to bonds and interest rates rise (expected), I lose principal. What is the difference?

Ha! My posts are descriptive, not prescriptive. This may be right, wrong, or not applicable. :)

I just thought it was interesting. Overall I think there are good reasons to be cautious, but others feel the opposite, so there is support for any planned action.

And if one uses an unvarying asset allocation this type data is N/A.

Ha
 
I am not sure that it tells me to change my asset allocation. If I move to bonds and interest rates rise (expected), I lose principal. What is the difference?

There is a risk / return component here. If you believe the median return for stocks will be 3.4% over the next 10 years, but with a large standard distribution of possible returns, are you better off owning stocks or 10-yr treasuries, now yielding 4%?

With respect to rising interest rates, what you experience is an opportunity cost. When held to maturity, your 10-yr treasuries will provide you with a 4% nominal return. Equity returns are an unknown.
 
Ha! My posts are descriptive, not prescriptive. This may be right, wrong, or not applicable. :)

I just thought it was interesting. Overall I think there are good reasons to be cautious, but others feel the opposite, so there is support for any planned action.

And if one uses an unvarying asset allocation this type data is N/A.

Ha

Ah! You are approaching guru-hood. :D Or Cassandra-ness. :(

It IS fascinating. I have been keeping an eye on PE10 predictions for some time. They worry me, but my AA seems to still be working.

All will be well if inflation is low.
 
Back
Top Bottom