Wealth in the U.S. - An Overview

See chart below and this is what I find even more worrisome than our debt levels. This shows Total Government Spending as a % of GDP. We're now in the 40% range and the trend line is steadily rising. How long before spending is over 50% of GDP? How long can we last with the government as the dominant actor in the economy?

usgs_line.php

I went to the site and fetched the actual chart.

Great site to explore!
 
See chart below and this is what I find even more worrisome than our debt levels. This shows Total Government Spending as a % of GDP. We're now in the 40% range and the trend line is steadily rising. How long before spending is over 50% of GDP? How long can we last with the government as the dominant actor in the economy?

usgs_line.php
Hmmm... Federal, State, Local. State & local governments are necessarily addressing deficits more aggressively than Federal (so far), some good news, and borne out by the chart judging by the slopes since the 2009 peak.

The site has a well known bias, though the data appears to be consistent with others.
 

Attachments

  • Breakout.png
    Breakout.png
    22.7 KB · Views: 7
Last edited:
So, just exactly who is this "government" :confused:

Is blue in top chart same as blue in lower chart, meaning Fed gov't? If so, the values are different for the blue guys... :(
 
Just curious about the total federal gov't spending since 1950. How much of the increase was Medicare?
 
So, just exactly who is this "government" :confused:

Is blue in top chart same as blue in lower chart, meaning Fed gov't? If so, the values are different for the blue guys... :(
I knew Fed spending was nowhere near 40% so I looked further. The first chart just lumped all together, I split it out and provided a legend...
 
Last edited:
Just curious about the total federal gov't spending since 1950. How much of the increase was Medicare?
Not sure I trust the site, never seen it before today...so FWIW. Rhetorical question to begin with I suspect...
 

Attachments

  • hc.png
    hc.png
    22 KB · Views: 4
Sadly, we mostly do what we're currently doing until then. We muddle along, knowing that our situation gets a little better each month as about 150k people get work again.

Job growth and getting the economy back on track are more important than deficit reduction. In fact, they are required to accomplish it.

The private economy spent 1980-2007 levering up. It is now in the process of deleveraging. Until it gets most of that done, we are not going to be able to cut the deficit meaningfully without risking a spiral into a deep depression.

Once we have a normalized job market, I expect we'll see a pickup in inflation and we can start cutting the deficit and potentially raise interest rates to deal with that much better problem.


Except all the projections I've seen (gov & private) suggest it will be 2017-18 before we get to 6% unemployment (considered "full" employment by many) given the path we're on. Have you seen any more optimistic?

Obviously growth and reducing unemployment take away the pain, how exactly do we do that under present circumstances?
 
I knew Fed spending was nowhere near 40% so I looked further. The first chart just lumped all together, I split it out and provided a legend...

All spending in blue chart shows 42%. Other chart in three colors shows >45%.

It might be that the numbers are not the numbers? LOL. :dance:

On a serious note, I think it helps if you know what feeds the numbers. In some charts the actual numbers don't come up for 2011, in other charts they are actual. Just an example that points out the datasets aren't all reconciled to each other.
 
See chart below and this is what I find even more worrisome than our debt levels. This shows Total Government Spending as a % of GDP. We're now in the 40% range and the trend line is steadily rising. How long before spending is over 50% of GDP? How long can we last with the government as the dominant actor in the economy?

usgs_line.php
"All other" spending looks relatively flat since 1980, and defense has decreased as a % of GDP. So evidently the problem is retirees compounded by health care cost increases well above inflation. :facepalm:
What do you think?
 

Attachments

  • fours.png
    fours.png
    13.7 KB · Views: 136
I don't see how a country/government's spending and a household's spending compare in any way. I don't see that the mission of a government and the objective of an idividual citizen or household line up at all. But that's just me......

Well in terms of the reality of how we run our country, they don't compare, and as Midpack pointed out a "reasonable deficit" has been OK historically as well as from the viewpoint of many economists. However, the country could learn a lesson in terms of applying common household budget sense in the way it operates. I have kids, and don't feel its fair that they should bear the burden of these foolish deficits that are taking us in the way of Greece.
 
All spending in blue chart shows 42%. Other chart in three colors shows >45%.

It might be that the numbers are not the numbers? LOL. :dance:

On a serious note, I think it helps if you know what feeds the numbers. In some charts the actual numbers don't come up for 2011, in other charts they are actual. Just an example that points out the datasets aren't all reconciled to each other.
The difference is probably government transfers, they didn't seem to appear when I tried to break out the numbers. Does that discount the point entirely? :cool:
 
Lazarus said:
I am just looking at it from an engineering perspective. I agree that the present or proposed levels will not meet the outgo. I don't think there is a claim that they will. I mean is it possible to raise taxes high enough to cover it at all? I am not asking for opinions just facts. Would some level of higher taxes cover it? I have no idea myself.

Here is a link from Heritage Foundation that states everyone's taxes would have to double to pay for the future entitlement programs if paid from income taxes.Ouch...Looking at the graph that would be pretty painful if this is true. But since I probably won't be around much after 2050, I would avoid the more painful 2080 tax brackets.

http://www.heritage.org/federalbudget/entitlements-double-tax-rates?ipad=true
 
I wouldn't put a whole lot of stock in any projection out to 2082.

Here is a link from Heritage Foundation that states everyone's taxes would have to double to pay for the future entitlement programs if paid from income taxes.Ouch...Looking at the graph that would be pretty painful if this is true. But since I probably won't be around much after 2050, I would avoid the more painful 2080 tax brackets.

Hiking Taxes to Balance the Budget Would Require Doubling Tax Rates
 
I don't see how a country/government's spending and a household's spending compare in any way. I don't see that the mission of a government and the objective of an idividual citizen or household line up at all. But that's just me......

True, but at the same time for any government to consistently spend more than it is taking in (other than perhaps for capital projects which have long term benefits) is irresponsible as it is just a generational transfer of wealth.
 
The difference is probably government transfers, they didn't seem to appear when I tried to break out the numbers. Does that discount the point entirely? :cool:
I believe the point that is being made is valid--that gov't spending as a percentage of GDP is rising. However, if one includes the complete graph (including 0%), then the rate of rise appears differently. Also, at that site it appears possible to generate different graphs, even when we believe the data is the same. But we can work around that.

I think my question then, is, "Are we receiving anything of value beyond what an average citizen received in 1950, for example?" If I seriously count up the things government has fostered that my family benefits from, then my answer is Yes. Can gov't do more with less? That's a tough question. It could mean my job, for instance.

A corollary question would be, "Is a rate of 42% so out of step with what other modern societies spend?" If I scan through the list at Government spending - Wikipedia, the free encyclopedia it appears we are higher than we have to be, but I don't see a decent nation out there that is at 20%, for example. Also, the gov't projections are that we will be heading to lower numbers. The charts in this thread show us headed to 38% and lower in a few years.
 
Hamlet said:
I wouldn't put a whole lot of stock in any projection out to 2082.

Without question you are correct. I doubt many forecasters at the end of our last fiscal year surplus a little over 10 years ago would have predicted the deficits we are producing yearly now, so 70 years out would be a tough one to project accurately. However, it is interesting for me to look at such graphs and others that people post.
 
I am somewhat reluctant to post this, as it smacks of wacko conspiracy theory stuff, and I agree that this should not be part of the forum.
In spite of this, there are financial transactions that are allowed and legal, that fall into the area called "shadow banking". Some of this surfaced in the MF Global situation, but there are many other parts of Banking that allow for transactions that are not in the public view. In particular the use of leveraged debt being multiplied by multiple transactions, and then being counted as collateral for establishing net assets.

The process is so obscure that there is limited oversight, except for some new European regulations that are currently being put in place.

Here's an excerpt that puts attempts to simplify the process. It discusses hypothecation.

For example, if you put a buck in your checking account and the bank has to keep 10% of that in reserve, it can loan out $0.90. But then, if somebody else deposits $0.90, the bank can loan out $0.81 cents or 90% of the total assets on deposit. And so on, until literally all the money on deposit is effectively hypothecated to another entity. This is why banks are constantly seeking new depositors - to feed the hypothecation machine and their profits.

Obviously a buck is still a buck no matter which way you cut it, so cash does count for something. But at the end of the day, any banks can create a daisy chain of rehypothecated assets that results in as much as $10 in new checking accounts and rehypothecated assets against every $1 in actual deposits. Perhaps more.

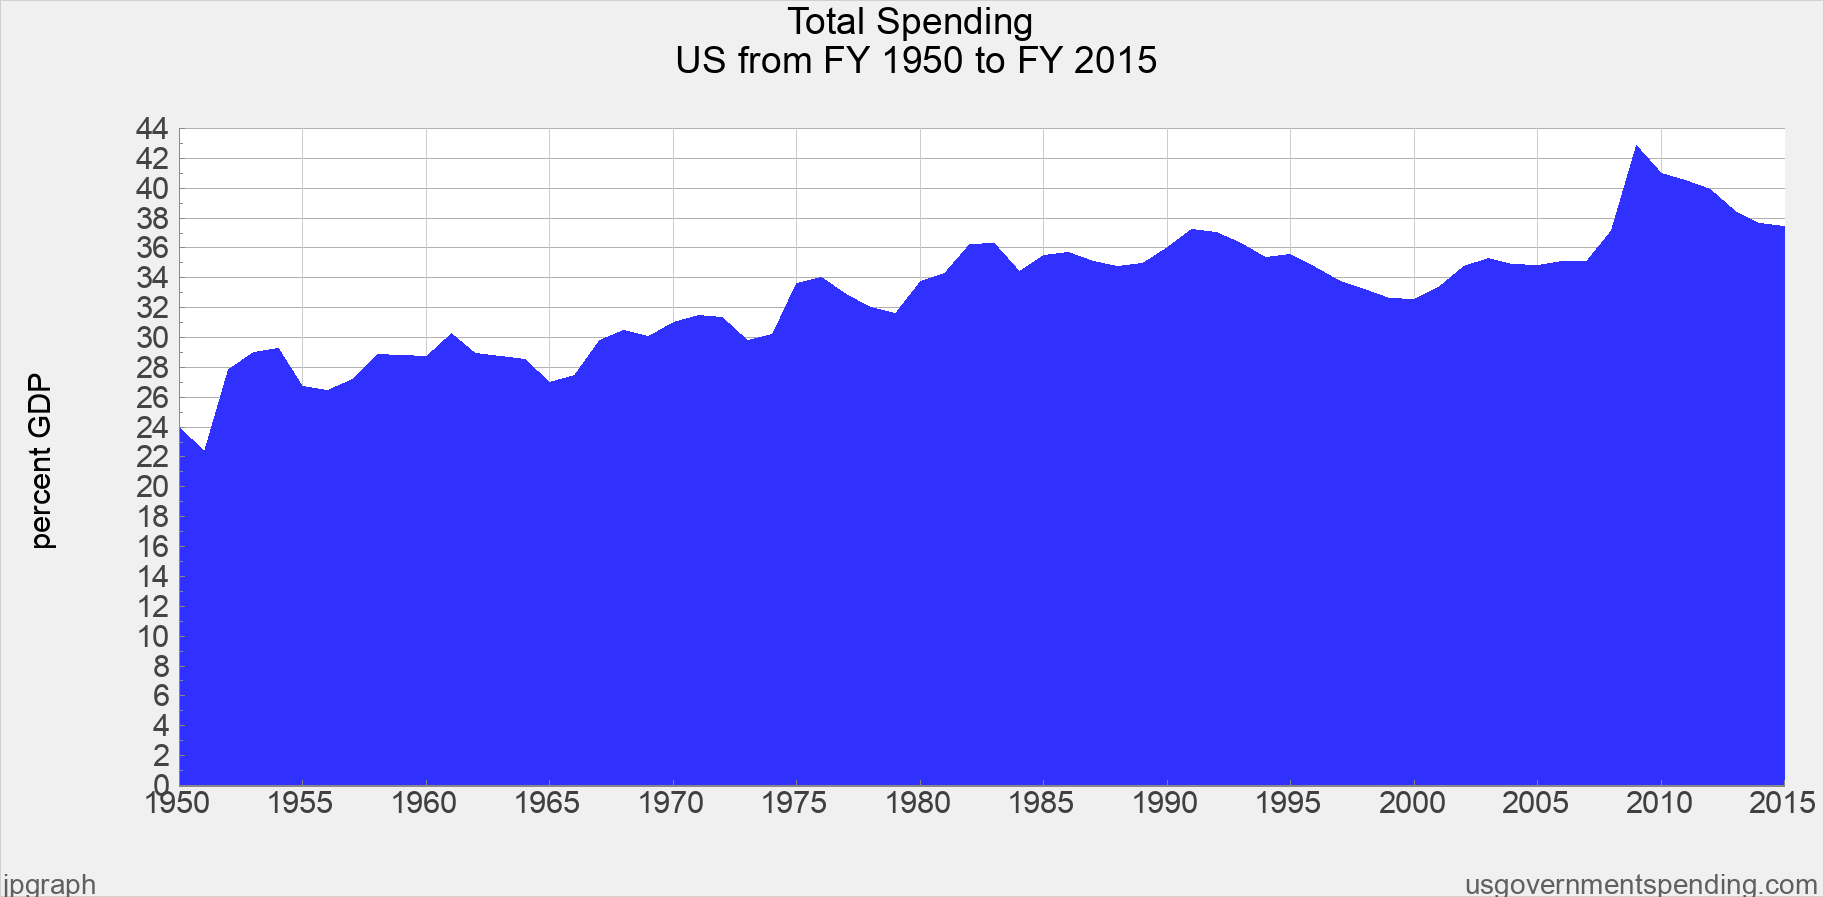
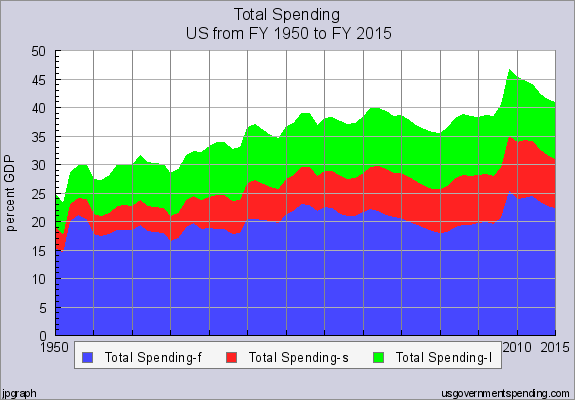
What is explained as the "hypothecation machine", is in effect "re-hypothecation".... and together with repos (repurchase agreements) are the tools used to multiply debt instruments... The general worry is that this could one of the major reasons for the growth of Bank Assets that was cited in the original post.

Bringing this down to a common denominator... Since all banking is based on trust, and a belief that loans and assets on deposit are backed with collateral... any thought that promissary notes, bonds, or other claims on stated assets might not be backed by liquidity would obviously cause panic... then this is the heart of the matter.

The theory extends back to the original bank bailout and the loans that were advanced to put off audits to determine the liquidity of the major banks. Despite the promises to unwind the housing value problems, and the derivatives markets, many people feel that it was a patchwork solution. The followup legislation ... Dodd-Frank, is still not implemented and being litigated with input from the banking industry.
...................................................................................

I don't buy into this, as I'm not smart enough or knowledgeable of the industry enough to know the difference between half truths, lies, or just cuckoo self promoters. I do see an increase in discussions that concern the end of bank counterparty guarantees, leveraged repo agreements, prop trading funds, and the probability of reducing the FDIC guarantees back to $100,000/account.

Despite a minor drop in the market as we approach the fiscal cliff, it doesn't seem than any of the major market players are predicting an endemic risk, and I haven't seen any scaremonger "end of the world" posts. Hopefully the experts understand whatever risk may exist. Still, it does no harm to understand the factors being discussed, or to have some options in the event of a sliding market.
 
Between the text quoted by pb4uski and the first line in the link
this thread is moving to the politics forum. How does this relate to FIRE?
Great joke!
 
Last edited:
Though it's an earlier proposed Federal budget for 2011, it's not that far off actuals. A nice visual IMO...
 

Attachments

  • budget2010.gif
    budget2010.gif
    54.7 KB · Views: 38
Imoldernu: You have described fractional reserve banking, which is nothing new. In fact, banks in the US have worked this way for well over 100 years. Most economists see it as a good thing, because it allows the economy to grow. Among other things, it is what permits entrepreneurs to create value by borrowing capital to start a business.
 
Last edited:
Imoldernu: You have described fractional reserve banking, which is nothing new. In fact, banks in the US have worked this way for well over 100 years. Most economists see it as a good thing, because it allows the economy to grow. Among other things, it is what permits entrepreneurs to create value by borrowing capital to start a business.


Yup there is even a series of fine Khan Academy videos on the subject.
I am currently listening to his commentary on the system very interesting.
 
Yup there is even a series of fine Khan Academy videos on the subject.
I am currently listening to his commentary on the system very interesting.

Thanks for the link. It may go a long way towards explaining some of the questions I've picked up in going through the Wiki article on the Fractional Banking System... and which prompted the OP. In particular in the "Criticisms" section of the Wiki article, where some of the explanations have been under fire for a while. In fact, the back and forth discussions by world economists, is much more interesting than the article itself, and runs to many pages of respectful discussion that go beyond "sound bytes".

Here is the lead in to the "criticisms" page.
Critics of fractional-reserve banking and proposals for monetary reform have included economists such as Irving Fisher[22] and Frank Knight.[23] U.S. Congressman Ron Paul and Austrian School economist Murray Rothbard have identified fractional-reserve banking, central banking, and fiat currency as interdependent and destructive features of modern monetary systems.[24][25] In Rothbard's analysis, the practice of fractional-reserve banking amounts to a form of fraud, embezzlement or legalized counterfeiting.[26][27]

I am thinking that this thread could get too confusing, and go beyond the interests of the forum, and be considered a political statement. FWIW, I have no dog in the fight, either politically or monetarily, but just as a matter of intellectual curiosity. I expect the "Khan" piece would satisfy those who want to get deeper into the subject.

Sometimes, trying to simplify, can get ya into trouble. :)
 
So if I'm reading this very nice chart correctly, "SS and other taxes" generate about $934B in revenue, while "SS expenditures" cost about $730B.

Even if you add Medicare's $491B, the deficit of those two combined is relatively mild vs their revenue... how did they get to be the big pole in the tent?

What I'd really like to see is what the $612B vaguely mentioned as "Mandatory Other" is for. What's that?
 
Last edited:
So if I'm reading this very nice chart correctly, "SS and other taxes" generate about $934B in revenue, while "SS expenditures" cost about $730B.

Even if you add Medicare's $491B, the deficit of those two combined is relatively mild vs their revenue... how did they get to be the big pole in the tent?

What I'd really like to see is what the $612B vaguely mentioned as "Mandatory Other" is for. What's that?

+1 was wondering the same thing about the $612B? I suppose the big issue for SS is really fewer workers supporting more SS recipients going forward, while medicare on the other hand remains the elephant in the bathtub in terms of the big pole in the tent.
 
In the chart it has defense as discretionary. I don't think that is true. But the amount we spend on it is a subject for discussion. There are some pretty big numbers in the other category of both discretionary and mandatory spending. Wish we knew the breakdown on those as well.
 

Latest posts

Back
Top Bottom