2018 YTD investment performance thread

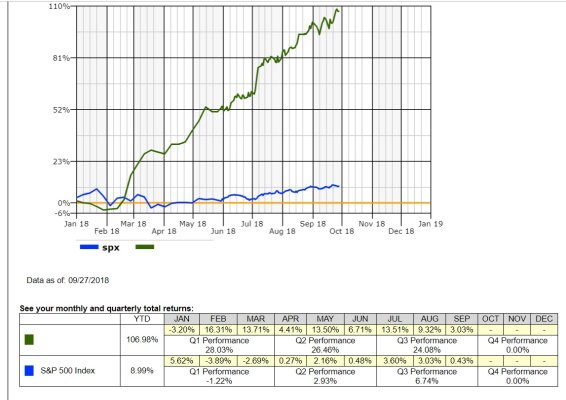
Up 3.8% ... on a pace to spend more than 4% of my investment/asset this year due to several unplanned expenses (e.g, paying 50% of DS's graduate school expense). Oh, well.

Dipped to +3.3%. Several of my stock funds took more hit than the rest.
 
My very low equity AA cause very low performance.
For my husband, 23% equities, 4.20% YTD
For my account, 27% equities, 5.40% YTD
 
My very low equity AA cause very low performance.
For my husband, 23% equities, 4.20% YTD
For my account, 27% equities, 5.40% YTD

Those are good relative numbers. SP500 up 9% YTD.
 
Went from 5.2% YTD on 8/31 to 4.6% YTD today. So, lost -0.6% in September.

Considering that international and EM are down, semiconductor sector down big (some holdings down more than -10% this month), I think it's amazing that I lost only 0.6% this month.

PS. By the way, the S&P is roughly flat this month, while the Dow went up 2%. Revenge of the stodgy stocks?

PPS. Speaking of stodgy stocks, Wellington and Wellesley did not do well this month. Hmmm...
 
Last edited:
From Jan. 1st through today (Sept. 18th) I'm up 9.3%.
 
4.20% through Sep YTD, but benchmark Vanguard LifeStrategy Moderate Growth Fund (VSMGX) was only 2.72% YTD.

Sep 304.20%
Aug 314.00%
Jul 313.04%
Jun 301.06%
May 311.24%
Apr 300.37%
Mar 310.12%
Feb 280.88%
Jan 313.53%
 
5.73% Total Portfolio Value increase YTD
3.66% YTD Performance
52-43-05 (Stk-Bnd-Csh) AA

Expert Analysis: EM and Bonds, meet the headwinds!
:D
September 2018
5.91% Total Portfolio Value increase YTD
0.18% Month increase from previous
3.41% YTD Performance, total pie weighted
52-43-05 (Stk-Bnd-Csh) AA

Expert Analysis: World is confused!
:cool:

Focus on Legacy 401K
See picture below for assets
Personal Rate of Return (YTD) - 4.08%
Percentage of total pie - 26.5%
 

Attachments

  • Capture.PNG
    Capture.PNG
    16.9 KB · Views: 31
YTD is just under 107% return. It has been rather a choppy climb though.
 

Attachments

  • ytd28.jpg
    ytd28.jpg
    200.9 KB · Views: 44
(+)5.46% YTD
77% Stock (52% US/25% International)
19% Bonds+CDs and 4%CASH
 
YTD 2018 investment performance

2018 YTD time weighted return, inclusive of dividends, interest and brokerage fees and exclusive of any withdrawals or additions to principal.

Portfolio - +30.4%
S&P 500 benchmark - +10.6%


Screenshot 2018-09-29 08.18.jpg


A robust portfolio performance during a strong third quarter for the US equity market. Big winners were AAPL, AMZN, CXO and SPY. I am over the moon with results.
 
You all are amazing. I’m dawdling along at 3.9% including withdrawals on 55/35/10 AA. Still ahead of projections from 4+ years ago.
 
You all are amazing. I’m dawdling along at 3.9% including withdrawals on 55/35/10 AA. Still ahead of projections from 4+ years ago.

Not sure if everyone is including withdrawals in their numbers.
 
During that time, I sold a lot of stocks to realize the loss for tax purposes. Not wanting to be out of the market too long in case of a bounce, I bought something else in the same sector to avoid the wash sales rule.

If you do index, I don't know what you can do. Sell S&P, and buy back large-cap, mid-cap, and small-cap separately? Maybe that can work, as the IRS does not have to time to check all that out with small investors.
Sell SPY & buy SCHB? Please correct if I'm wrong: but isn't it just that you cannot buy back into the same symbol within 30 days?
 
Since this is about investment returns, withdrawals or additions to principal should not be factored in.

Google ‘time weighted return’ for explanation.
Well I've only taken out a little but then I'm doing it wrong. I'm just looking at total value which I guess differs from total return. Rolling taxable dividends out to checking (no additions)
 
Help me understand how you get your YTD percent. If I use this calculator and enter 1 month I see a large percentage for YTD.
Investment Return Calculator: Measure your Portfolio's Performance

So the proper way would be enter 12 month's right?


Hmmm, I thought this was what most people were using. There was discussion back in January about it. I just looked and the same tool was referred to in prior years threads as well.

Using a more detailed version

https://www.rateofreturnexpert.com/time-weighted-return-calculator/

I’m at 4.5%.

Oh well, as a wise woman once told me, ‘it’s all just numbers on a page’.
 
Last edited:
I don’t know whether I had input correctly or not but according to the calculator above, I had above 13% on one account. I take it, but do I believe it. No.

Edit to add, I did it wrong. The return was much lower. Than 13% on one account.
 
Last edited:
Sell SPY & buy SCHB? Please correct if I'm wrong: but isn't it just that you cannot buy back into the same symbol within 30 days?

The IRS rule says the wash sale rule applies to "substantially identical" equities. This of course is open to interpretation.

If you trade SPY (S&P 500 index) ETF for shares of the Vanguard MF VFINX, or Vanguard ETF VOO, then they are definitely the same.

I think you can get away with SPY and SCHB. If you trade Merk for Pfizer, or Analog Devices for Texas Instruments, then it is definitely safe. In a market downturn, stocks in the same sector track each other fairly well in the short term. The tide lifts or lowers all boats.

During 2008-2009 Great Recession, whether you bought or sold was more important than what stock you bought or sold. I should have just loaded up on the whole index than spent the time picking stocks. Maybe next time. :)
 
Last edited:
2.4% YTD, all-in, money-chip style spend adjustment. Last month it was 3.2%, so gave back -0.8%. Didn't try to get underneath to see which asset classes were the problem, but I think NW was saying international and EM.
 
Back
Top Bottom