2019 YTD Investment Performance Thread

I however do keep track of the daily total portfolio value, which is just a single number logged for each day. And it shows that from the top on 2000/03/24 to 2002/10/09, I had 56 cents on the dollar. And this happened at a time when I was closing down the local office of our start-up, being the last guy to turn the light off before closing the door.

At that point, I thought that life could not be gloomier. And just 3 years later, I was back riding high, and felt confident enough to buy my 2nd home.

How exciting life is! You never know what is around the corner. Exhilaration or imminent death?

Yep, I went through a similar thing in that 2000-2002 timeframe. I'd usually track my portfolio value daily, although I'd usually keep a record of numbers that caught my eye, for whatever reason. And in those earlier years I wasn't always that consistent. It wasn't until 2007 that I kept a data point for every month. I was close in 2006, but for some reason did not record anything for July. Starting in September of 2011, I started only preserving the last trading day of the month for posterity, to make it easier to compare year-over-year, rather than only preserving extreme peaks and valleys.

But, interestingly, I did record 3/23/2000 as a new all-time high for me. I had a whopping $49,290 in investable assets saved up. Seemed like a really big deal at the time. I was just about to turn 30. And less than a year and a half before, in November of 1998, I had finished paying off about $30,000 that a bad marriage/divorce had cost me.

I only kept a few data points for 2002, for some reason, possibly because as a whole, the year was so depressing. But, I did keep 7/22/02, where I was at $48,234. I think that was where I hit bottom in 2002. While that number doesn't seem that far off of the 3/23/00 number, I had sunk in a lot of additional investments in that timeframe. Overall, I lost 5.4% in 2000, as a whole, 30.4% in 2001, and 23.1% in 2002. If I just measured from that 3/23/00 period to 7/22/02, I'm sure my total loss was even worse! FWIW, I might have actually been worse off, return-wise, by 10/9/02, but the way I was adding money that year, my asset value was probably higher. And, with relatively small value I had back then, each additional investment carried a lot more weight.
 
27.2% 85/15 using XIRR in excel. What a year! Did some big ROTH conversions and paid a lot of taxes, and the balance just keeps on chugging. That 15% is in cash, and burning a hole in my investing pocket. Waiting for something to go on sale. If that is what it takes to keep the market chugging, so be it!
 
.... The best part is, after 4 years of retirement and all spending coming from these accounts, we have 32% more money than the day I retired.:dance:

Yes, life is good. 8 years here and end of 2019 is 125% of beginning of 2012... and that is after 3 big withdrawals that were not in the plan... a winter condo paid in cash and subsequent kitchen remodel, replacing a one-car garage with a winterized 2-car garage and bonus loft and early payoff of our mortgage... if I add those things back then end of 2019 would be 143% of the beginning of 2012.
 
34% at about 70/30. Very happy as this was my first year of retirement and was worried about SORR with the long bull market. Still not out of the woods yet, of course. But a 20% drop doesn't look as scary now.
 
... to pay off our 3.375% mortgage on the last day of the year.

...

Congratulations on getting rid of that note. Must feel great to free up some cash flow. Loving everyone's #s this year!
 
Congratulations on getting rid of that note. Must feel great to free up some cash flow. Loving everyone's #s this year!

Thanks, but to be honest, I'm fairly indifferent about it... I'm not :dance: like many posters who relish being "debt-free" would be. To me the mortgage was just an arbitrage thing and the monthly payments were on autopay so it wasn't much of a burden at all.

It just means that I will reduce my monthly "paycheck" (transfer from retirement accounts to our local checking account that we use to pay bills from) by roughly the amount of the mortgage payment so our withdrawals and WR will be lower.
 
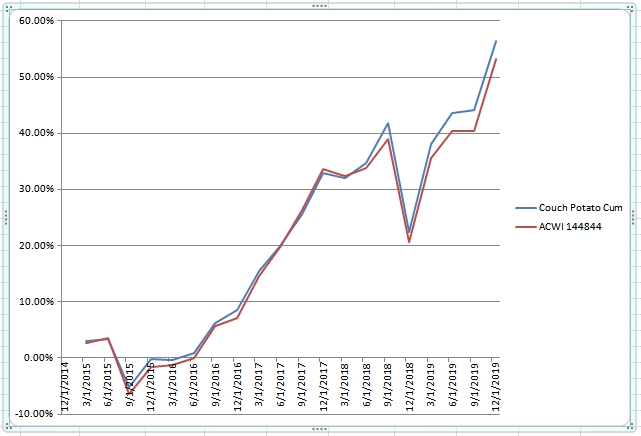
Looking at a year like 2019 can be fun, but I like to look over longer periods. On 1/1/15 I invested $100K into what I call my "couch potato" portfolio. From that point dividends reinvested and no rebalancing. It started at 65% USA total market and 35% international total market. I use it as a benchmark for tracking various portfolios that I am involved with. I also track it against the All Country World Index (ACWI). FWIW here is the five year result:

38349-albums210-picture2082.jpg


A couple of things I've noticed:

First, the couch potato has been running slightly ahead of the ACWI. No real surprise there, as the CP has significant home country bias and international stocks have been weaker than the US for a while. Last quarter that changed. A new trend or just a burble? Ask me in a few years.

Second, our dramatically good % numbers for 2019 are due in large part to the 4Q18 market hit. Just eyeballing, if the market had been flat 4Q18 the 2019 numbers probably would have been a bit under 20%.

(In the unlikely event that someone would like the 5 years of quarterly CP numbers I'd be happy to send them. Just PM me with a good email address.)
 
I'm up 22.64% on a portfolio of dividend stocks, preferred stocks and individual bonds. No complaints here!!! :dance:
 
2019 return 23.45%. Benchmark VTHRX (Vanguard Target Retirement 2030) was 21.07%.

Allocation (stock/bond) follows VTHRX, currently 69/31.
 
Looks like retirement assets are up 22.6% for 2019. Still hard to believe.
 
My return, all-in, money-chimp style calculation was 17.8% on a 67/30/3 allocation. Of the 67, half was international and the other half split between REIT and US Large Cap. So didn't take part in the S&P party as much. But I'll take a year like this anytime it's offered. Beats last year, when it took everything back at the end.
 
19.18% for the year with an AA of 50/40/10. I'll take it. I fiddled around with AA today and was shocked I don't need to do any rebalancing. I did do a little rebalancing in July, so all is well that ends well.

2013 was my best year, at 22.17%
 
34% in my managed accounts
24% in my Financial Advisors accounts
Similar allocations less my near 1% to them.

I started transferring fully out of the managed accounts in Dec.
 
18.41% overall. 22% international and 10% cash held me back a little....slight tilt to small cap vs. large caps didn't help either....Dollar costed in pension lump sum which represented about 8% of stash. Fixed income at 42% of total. Cash hoard is going to get burned in next 12 months if I stick to my "Blow the dough" plan.


1.6% withdrawal rate in 2019 based on year end values. Slowly starting to ratchet the spending up a bit. Going from hyper-saver to spender ain't easy.
 
Last edited:
For 2019, our portfolio was up 23.2%. Almost same figures using XIRR and moneychimp. This excludes our rental property and a small amount of cash.

A simple 50/20/30 mix of VTI/VXUS/BND was up 22.3%.

Our portfolio is 70/30-ish but only 10% international equity. So that helped a bit relative to the simple benchmark. Also helping was a heavy tilt to corporate bond funds like LQD, up 17.1%. We also have some REITs and a tilt to value/high-dividend, both of which did well but not as well as VTI, so that hurt a bit relative to the benchmark.

Certainly nothing to complain about this year. Portfolio is at an all-time high and up 42% from the day I retired in 2013.
 
Around 12% for FY2019 with a roughly 30/70 AA


Just did my last month spreadsheet update. Annualized, my 401K did 31% in Dec 2019, overall portfolio about 24%.
 
Back
Top Bottom