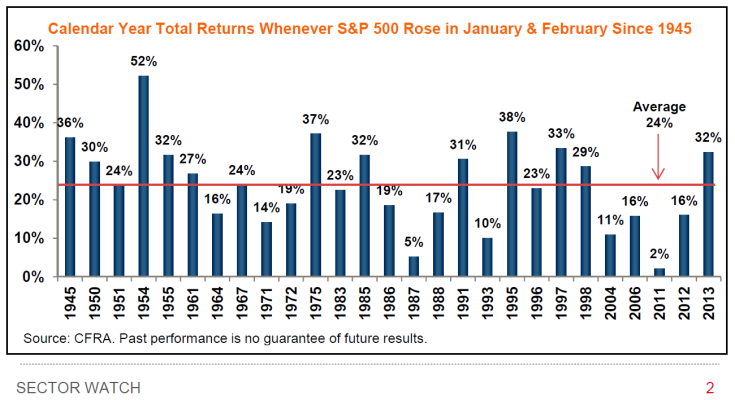
I wonder what they mean by "achieved gains" in January and February. More than just 27 of the past 72 years were up by Mar 1st of the year.
Maybe it means gains in each January, and in February? Which I think is more likely, though lost in the context of how it's written. However, in 1962 the market was up in January 1.7% and up in February 0.1% (0.0996866989% to be exact) but then finished the year down 9% total. I suppose someone could use some creative math to round the February gain down to 0% and call it "not a gain" to exclude it from this chart... though the S&P did go from 70.22 to 70.29 that month... which is certainly a gain
")
Maybe it means, gains of more than X percent... in those first two months, which makes the lure of this statistic less majestic (and maybe why it was left out?).
Maybe I'm missing something here?
Anyway, I decided to look at the inverse of this for comparison... and see what Jan and Feb looked like in the years the S&P fell (which isn't as often as you'd think)
In fact, when counting for dividends, there have only been 16 years (in total return) that the S&P lost value since 1945. Here they are, along with what happened in January and February
2008 the S&P500 was
down 4.4% by Mar 1st and finished
down 37% for the year
2002 the S&P500 was
-up- 1.2% by Mar 1st and finished
down 22% for the year
2001 the S&P500 was
down 11.2% by Mar 1st and finished
down 11% for the year
2000 the S&P500 was
-up- 1.2% by Mar 1st and finished
down 9% for the year
1990 the S&P500 was
down 0.4% by Mar 1st and finished
down 3% for the year
1981 the S&P500 was
-up- 0.1% by Mar 1st and finished
down 5% for the year
1977 the S&P500 was
down 3.1% by Mar 1st and finished
down 8% for the year
1974 the S&P500 was
-up- 1.4% by Mar 1st and finished
down 27% for the year
1973 the S&P500 was
down 5.1% by Mar 1st and finished
down 15% for the year
1969 the S&P500 was
down 2.6% by Mar 1st and finished
down 9% for the year
1966 the S&P500 was
down 4.8% by Mar 1st and finished
down 10% for the year
1962 the S&P500 was
-up- 1.8% by Mar 1st and finished
down 9% for the year
1960 the S&P500 was
down 5.2% by Mar 1st and finished
down 1% for the year
1957 the S&P500 was
down 3.1% by Mar 1st and finished
down 9% for the year
1953 the S&P500 was
down 0.7% by Mar 1st and finished
down 1% for the year
1946 the S&P500 was
down 2.7% by Mar 1st and finished
down 12% for the year
Anyway, there are years the market was -up- in Jan and Feb (cumulative) but lost on the year. In fact, as recently as 2002, the market was up over a percentage in January/February but lost 22% on the year by Dec 31st.
References:
(yearly returns:
CAGR of the Stock Market: Annualized Returns of the S&P 500)
(Jan 01 - Mar 01 returns per year calculated from Shiller data)