kyounge1956
Thinks s/he gets paid by the post
- Joined
- Sep 11, 2008
- Messages
- 2,171
I've just been running some last-minute checks in FireCalc. I put in my portfolio balance, asset allocation, pension income and so on, and got 100% success on any length of retirement up to 40 years, with the ending portfoliio always larger than the starting value.
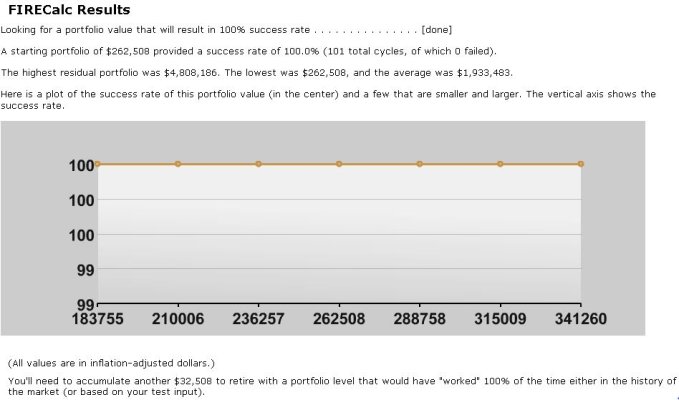
I then went to the Investigate tab, and without changing any of the inputs, asked what size portfolio I needed for 100% success. The result was about $32K more than my original input. I asked for a spending level and the result was about $5K/year less than my original input. The plots for both Investigate portfolio (below) and Investigate spending level show 100% success even with portfolios quite a lot smaller, or spending quite a bit higher, than my original input.
I'm confused. Why the disparity in the results?
I just tried another little experiment--if I cut the length of retirement in half, from 40 to 20 years, there is no change to the portfolio size needed for 100% success. How can that be right? What am I missing?
Attachments
Last edited: